
Battle Of The Altcoins: Ripple Ready For Another Assault On Ethereum, XRP/USD Levels
Ripple stands out from the other top cryptocurrencies by falling less than they do in times of trouble and rising more than others. Its market capitalization is breathing in Ethereum’s neck once again. What levels does it target?
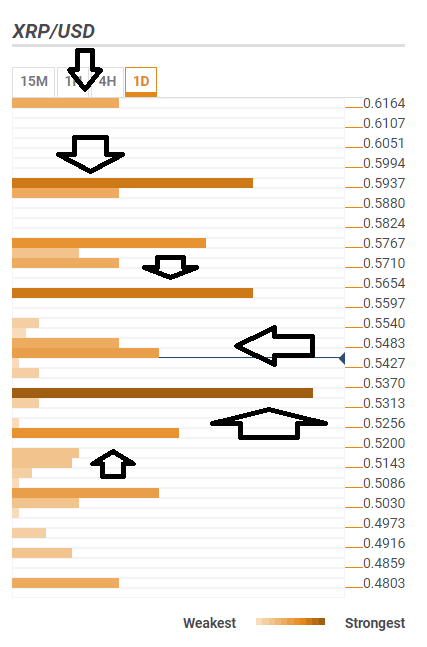
The Technical Confluence Indicator shows that the XRP/USD is around the convergence area of $0.5450 where we see the Bolinger Band 15m-Middle, the Simple Moving Average 5-1h, the SMA 5-one-day, and the SMA 5-15m.
The first target is $0.5654 where the Pivot Point one-month Resistance 2 is notable. The next target is $0.5937 where we see the meeting point of the Fibonacci 161.8% one-month, a significant indicator, and the BB one-day Upper. Looking higher, $0.6164 is the PP one-day R2.
Ripple has strong support at $0.5313 which is the confluence of the powerful SMA 10-1h, and the SMA 200-one-day. Further support is at $0.5256 where we see the BB 4h-Middle and the Fibonacci 23.6% one-day converge.
Here is how it looks on the tool:
The Confluence Detector finds exciting opportunities using Technical Confluences. The TC is a tool to locate and point out those price levels where there is a congestion of indicators, moving averages, Fibonacci levels, Pivot Points, etc. Knowing where these congestion points are located is very useful for the trader, and can be used as a basis for different strategies.
Disclaimer: Foreign exchange (Forex) trading carries a high level of risk and may not be suitable for all investors. The risk grows as the leverage is higher. Investment objectives, risk appetite and ...
more

