AUD/USD Tumbles Following US Jobs Report, RBA Decision Awaited
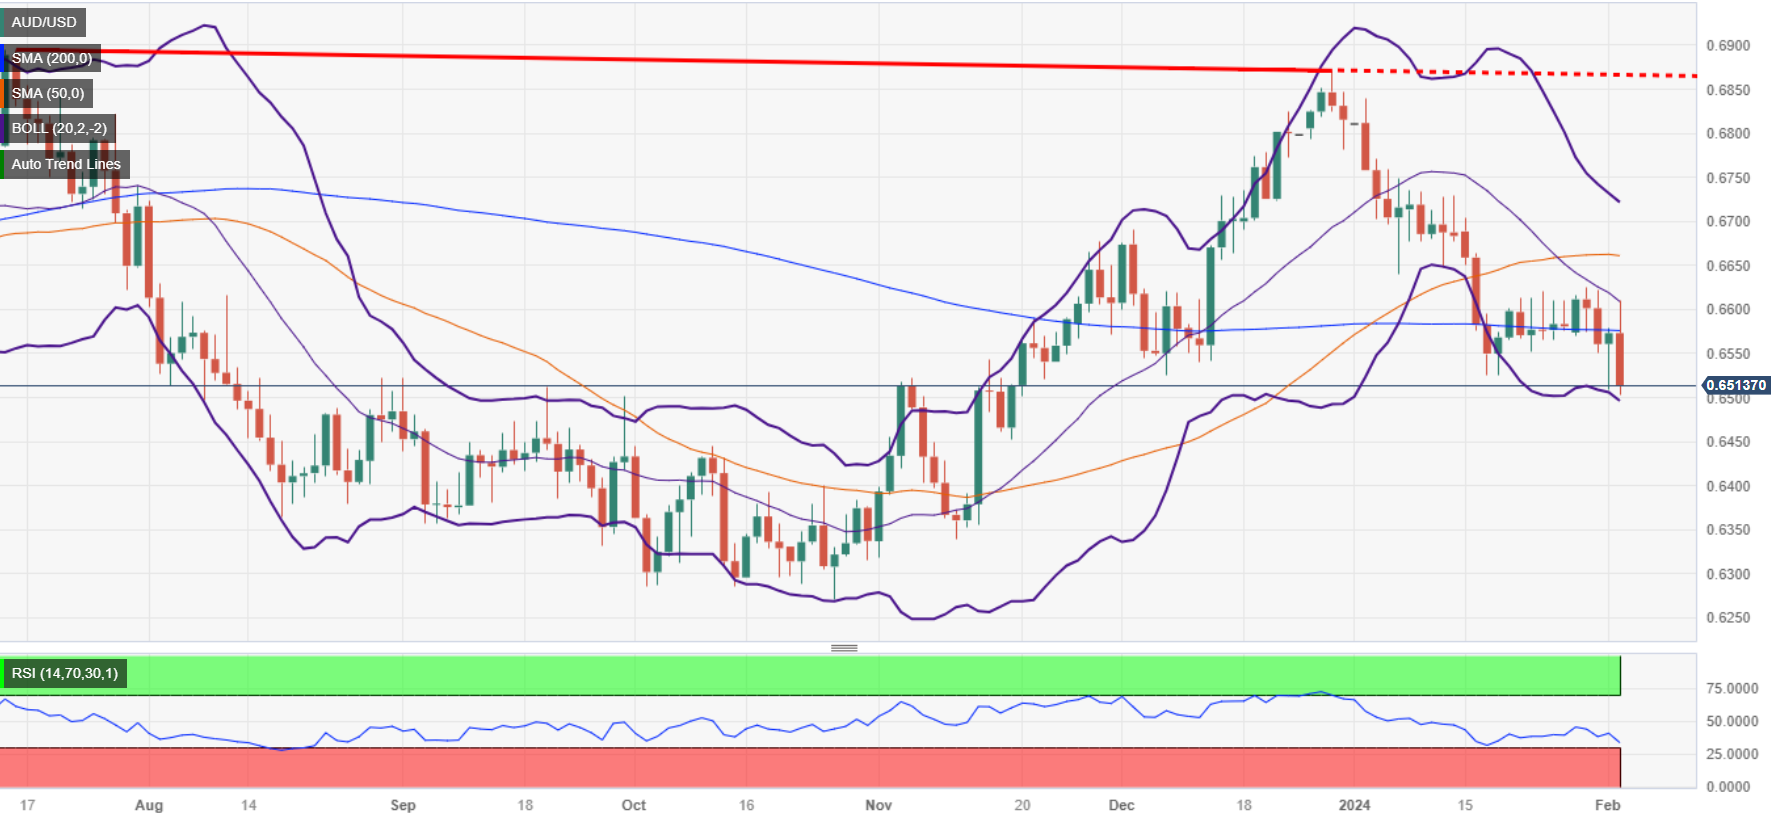
The AUD/USD plunged more than 0.90% on Friday after a robust US Nonfarm Payrolls report triggered a jump in US Treasury yields as investors disregarded a rate cut by the Federal Reserve in March. At the time of writing, the pair traders at 0.6511
Aussie Dolla falls on January’s NFP, traders eye RBA’s meeting
The latest US Nonfarm Payrolls report exceeded expectations, with the economy adding 353K jobs, far surpassing the forecasted 180K and outdoing the revised December figures of 333K, initially reported as 216K. Unemployment Rate remained steady at 3.7%, unchanged from the previous month. Furthermore, Average Hourly Earnings (AHE) saw an increase, with the monthly AHE rising to 0.6% from 0.4% and the year-over-year rate climbing to 4.5% from 4.4%.
Following this report, the yield on the US 10-year Treasury note rose from around 3.90% to 4.06%, gaining 15 basis points (bps). Additionally, the US Dollar Index (DXY), which measures the dollar's strength against a basket of major currencies, rose to a seven-week high at 104.04 after the data.
Further data was released, with Factory Orders for newly manufactured goods climbed modestly, while Consumer Sentiment by the University of Michigan improved to 79.1 in January.
Next week, the Aussie’s economic calendar will feature the Reserve Bank of Australia (RBA) monetary policy decision, followed by RBA’s Governor Michele Bullock's press conference. After that, the Aussie Dollar could gauge direction from the release of the AI Group Industry Index, Westpac Consumer Confidence, and NAB Business Confidence data.
AUD/USD Price Analysis: Technical outlook
After diving below the 200-day moving average (DMA), the AUD/USD has shifted neutral to downward biased, piercing on its way south of the 100-DMA at 0.6527. A daily close below those levels will expose the 0.6500 figure, followed by the psychological 0.6500 mark. On the other hand, if Aussie buyers regain the 100-DMA, the next resistance would be 0.6550, before the 200-DMA.
(Click on image to enlarge)
AUD/USD
| OVERVIEW | |
|---|---|
| Today last price | 0.6515 |
| Today Daily Change | -0.0058 |
| Today Daily Change % | -0.88 |
| Today daily open | 0.6573 |
| TRENDS | |
|---|---|
| Daily SMA20 | 0.6619 |
| Daily SMA50 | 0.6663 |
| Daily SMA100 | 0.6534 |
| Daily SMA200 | 0.6577 |
| LEVELS | |
|---|---|
| Previous Daily High | 0.6579 |
| Previous Daily Low | 0.6508 |
| Previous Weekly High | 0.6621 |
| Previous Weekly Low | 0.6552 |
| Previous Monthly High | 0.6839 |
| Previous Monthly Low | 0.6525 |
| Daily Fibonacci 38.2% | 0.6552 |
| Daily Fibonacci 61.8% | 0.6535 |
| Daily Pivot Point S1 | 0.6528 |
| Daily Pivot Point S2 | 0.6483 |
| Daily Pivot Point S3 | 0.6457 |
| Daily Pivot Point R1 | 0.6599 |
| Daily Pivot Point R2 | 0.6624 |
| Daily Pivot Point R3 | 0.667 |
More By This Author:
EUR/GBP Edges Mildly Higher, Still Tallies A Losing WeekSilver Price Analysis: XAG/USD Consolidates Around 100-Day SMA, Below 50% Fibo.
USD/JPY Price Analysis: Advances To Near 146.60 Amid A Momentum Shift
Disclaimer:
Besides this article I also use the Forex "Ranking, Rating and Score" which is also available once a week on my blog. In the article "Ranking, Rating and ...
more


