
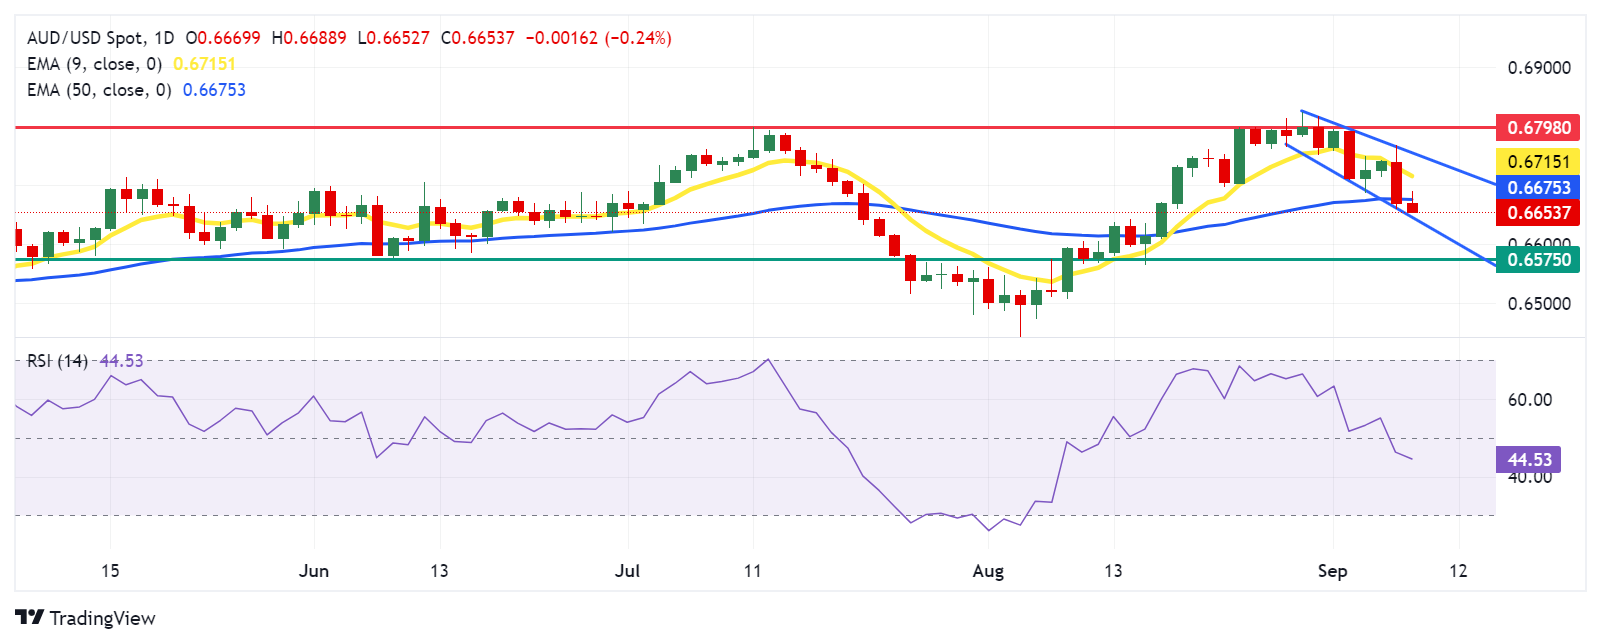
AUD/USD extends its losses for the second consecutive day, trading around 0.6650 during the European hours on Monday. The daily chart analysis shows that the pair is trekking down along the lower boundary of the descending channel, suggesting the reinforcing of a bearish bias.
Additionally, the 14-day Relative Strength Index (RSI) falls below the 50 level, confirming the ongoing bearish trend for the AUD/USD pair.
However, the daily chart analysis also indicates that the 9-day Exponential Moving Average (EMA) is positioned above the 50-day EMA, which is typically interpreted as a short-term bullish signal. This suggests that the recent price action is outperforming the longer-term trend.
On the downside, the AUD/USD pair targets the lower boundary of the descending channel around the level of 0.6640. A break below this level could strengthen the bearish bias and lead the pair to navigate the region around the throwback support at 0.6575.
In terms of resistance, the immediate barrier appears at the 50-day EMA at 0.6675 level, followed by the nine-day EMA at 0.6715 level. A breakthrough above the latter could weaken the bearish bias and support the AUD/USD pair to test the upper boundary of the descending channel around the 0.6750 level.
A breach above the descending channel could extend the upside and lead the pair to explore the region around its seven-month high of 0.6798, reached on July 11.
(This story was corrected on September 9 at 10:30 GMT to say that the the lower boundary of the descending channel is at 0.6640, not 0.6440.)
AUD/USD: Daily Chart
(Click on image to enlarge)
Australian Dollar PRICE Today
The table below shows the percentage change of Australian Dollar (AUD) against listed major currencies today. Australian Dollar was the weakest against the Canadian Dollar.
| USD | EUR | GBP | JPY | CAD | AUD | NZD | CHF | |
|---|---|---|---|---|---|---|---|---|
| USD | 0.32% | 0.32% | 0.79% | 0.03% | 0.23% | 0.65% | 0.43% | |
| EUR | -0.32% | -0.05% | 0.52% | -0.28% | -0.14% | 0.34% | 0.10% | |
| GBP | -0.32% | 0.05% | 0.43% | -0.23% | -0.08% | 0.37% | 0.15% | |
| JPY | -0.79% | -0.52% | -0.43% | -0.75% | -0.53% | -0.15% | -0.15% | |
| CAD | -0.03% | 0.28% | 0.23% | 0.75% | 0.25% | 0.60% | 0.57% | |
| AUD | -0.23% | 0.14% | 0.08% | 0.53% | -0.25% | 0.46% | 0.20% | |
| NZD | -0.65% | -0.34% | -0.37% | 0.15% | -0.60% | -0.46% | -0.22% | |
| CHF | -0.43% | -0.10% | -0.15% | 0.15% | -0.57% | -0.20% | 0.22% |
The heat map shows percentage changes of major currencies against each other. The base currency is picked from the left column, while the quote currency is picked from the top row. For example, if you pick the Australian Dollar from the left column and move along the horizontal line to the US Dollar, the percentage change displayed in the box will represent AUD (base)/USD (quote).
More By This Author:
USD/CAD Price Forecast: Holds Ground Above 1.3500, Next Barrier Appears At Nine-day EMAAUD/JPY Moves Below 98.50 As Traders Adopt Caution Due To China Economic Woes
GBP/JPY Drops To Near 192.00 Due To Increasing Risk Aversion


Comments
Log in or sign up to join the conversation.