
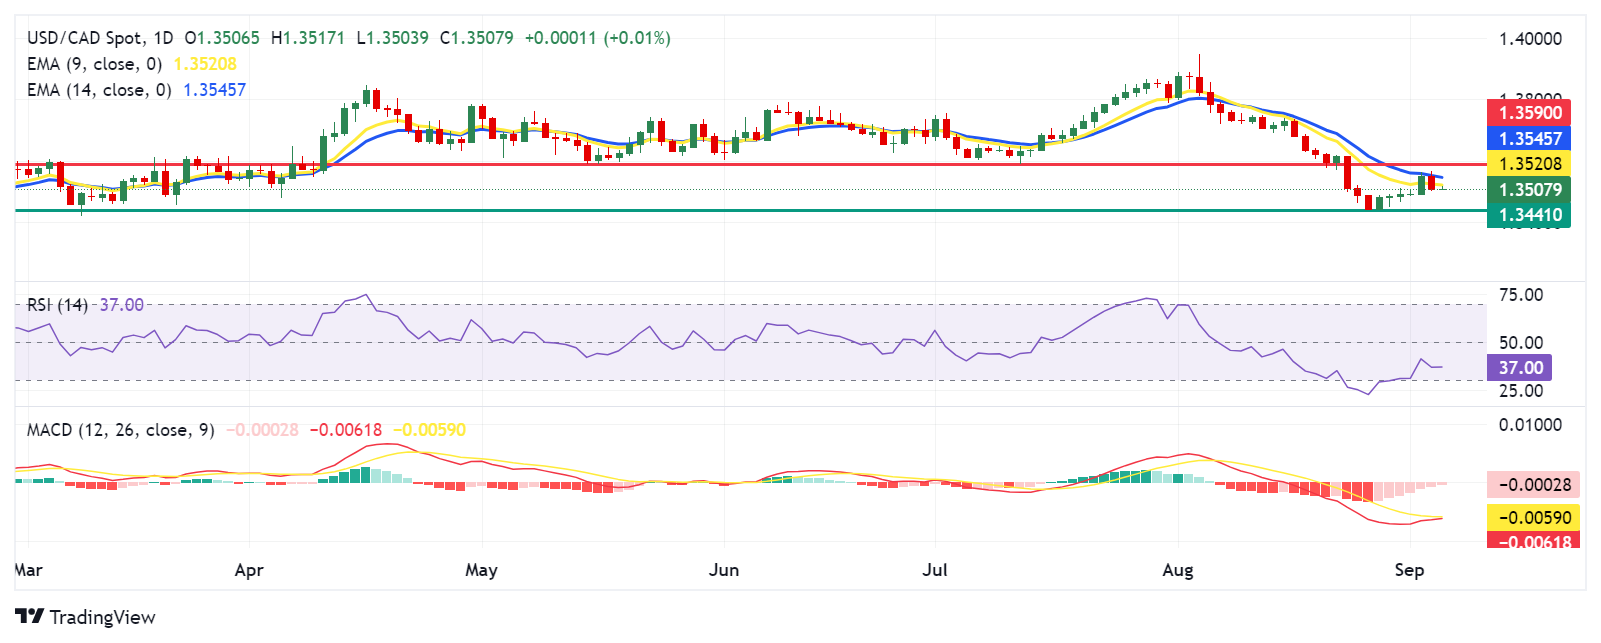
USD/CAD moves sideways around 1.3510 during European hours on Thursday. Analysis of the daily chart indicates a bearish bias for the USD/CAD pair, as the nine-day Exponential Moving Average (EMA) is positioned below the 14-day EMA.
Additionally, the 14-day Relative Strength Index (RSI) remains near the 30 level, confirming the overall bearish trend in play but also suggesting a potential correction soon.
The momentum indicator Moving Average Convergence Divergence (MACD) suggests a downward trend for the USD/CAD pair, as the MACD line is positioned below the centreline. However, the MACD line may crossover above the signal line, suggesting a potential weakening of the bearish trend.
On the downside, the USD/CAD pair tests the psychological level of 1.3500. A break below this level could reinforce the bearish bias and push the pair to navigate the region around the seven-month low at 1.3441, recorded on August 28.
In terms of resistance, the immediate barrier appears at the nine-day EMA at 1.3521 level, followed by the 14-day EMA at 1.3546 level. A breakthrough above these EMAs could weaken the bearish bias and lead the pair to test the "throwback support turns into a pullback resistance" level at 1.3590, followed by the psychological level of 1.3600.
USD/CAD: Daily Chart
(Click on image to enlarge)
Canadian Dollar PRICE Today
The table below shows the percentage change of Canadian Dollar (CAD) against listed major currencies today. Canadian Dollar was the weakest against the British Pound.
| USD | EUR | GBP | JPY | CAD | AUD | NZD | CHF | |
|---|---|---|---|---|---|---|---|---|
| USD | -0.15% | -0.16% | -0.09% | 0.00% | -0.07% | -0.06% | -0.05% | |
| EUR | 0.15% | 0.00% | 0.10% | 0.17% | 0.08% | 0.13% | 0.10% | |
| GBP | 0.16% | -0.00% | 0.09% | 0.19% | 0.08% | 0.13% | 0.09% | |
| JPY | 0.09% | -0.10% | -0.09% | 0.11% | 0.00% | 0.02% | 0.04% | |
| CAD | -0.00% | -0.17% | -0.19% | -0.11% | -0.07% | -0.05% | -0.07% | |
| AUD | 0.07% | -0.08% | -0.08% | -0.01% | 0.07% | 0.03% | 0.02% | |
| NZD | 0.06% | -0.13% | -0.13% | -0.02% | 0.05% | -0.03% | -0.02% | |
| CHF | 0.05% | -0.10% | -0.09% | -0.04% | 0.07% | -0.02% | 0.02% |
The heat map shows percentage changes of major currencies against each other. The base currency is picked from the left column, while the quote currency is picked from the top row. For example, if you pick the Canadian Dollar from the left column and move along the horizontal line to the US Dollar, the percentage change displayed in the box will represent CAD (base)/USD (quote).
More By This Author:
AUD/JPY Moves Below 98.50 As Traders Adopt Caution Due To China Economic WoesGBP/JPY Drops To Near 192.00 Due To Increasing Risk Aversion
GBP/USD Advances Toward 1.3150 Due To Risk-On Mood


Comments
Log in or sign up to join the conversation.