
AUD/USD has been in an uptrend all through August. It reached a new peak of 0.6824 on August 29 and then pulled back.
The correction so far is a three wave structure, perhaps an ABC correction, suggesting it is just a counter-trend reaction and the uptrend will probably resume.
If AUD/USD can close back above 0.6800 it will signal a continuation of the uptrend back up to the 0.6824 high first, then possibly higher.
AUD/USD 4-hour Chart
(Click on image to enlarge)
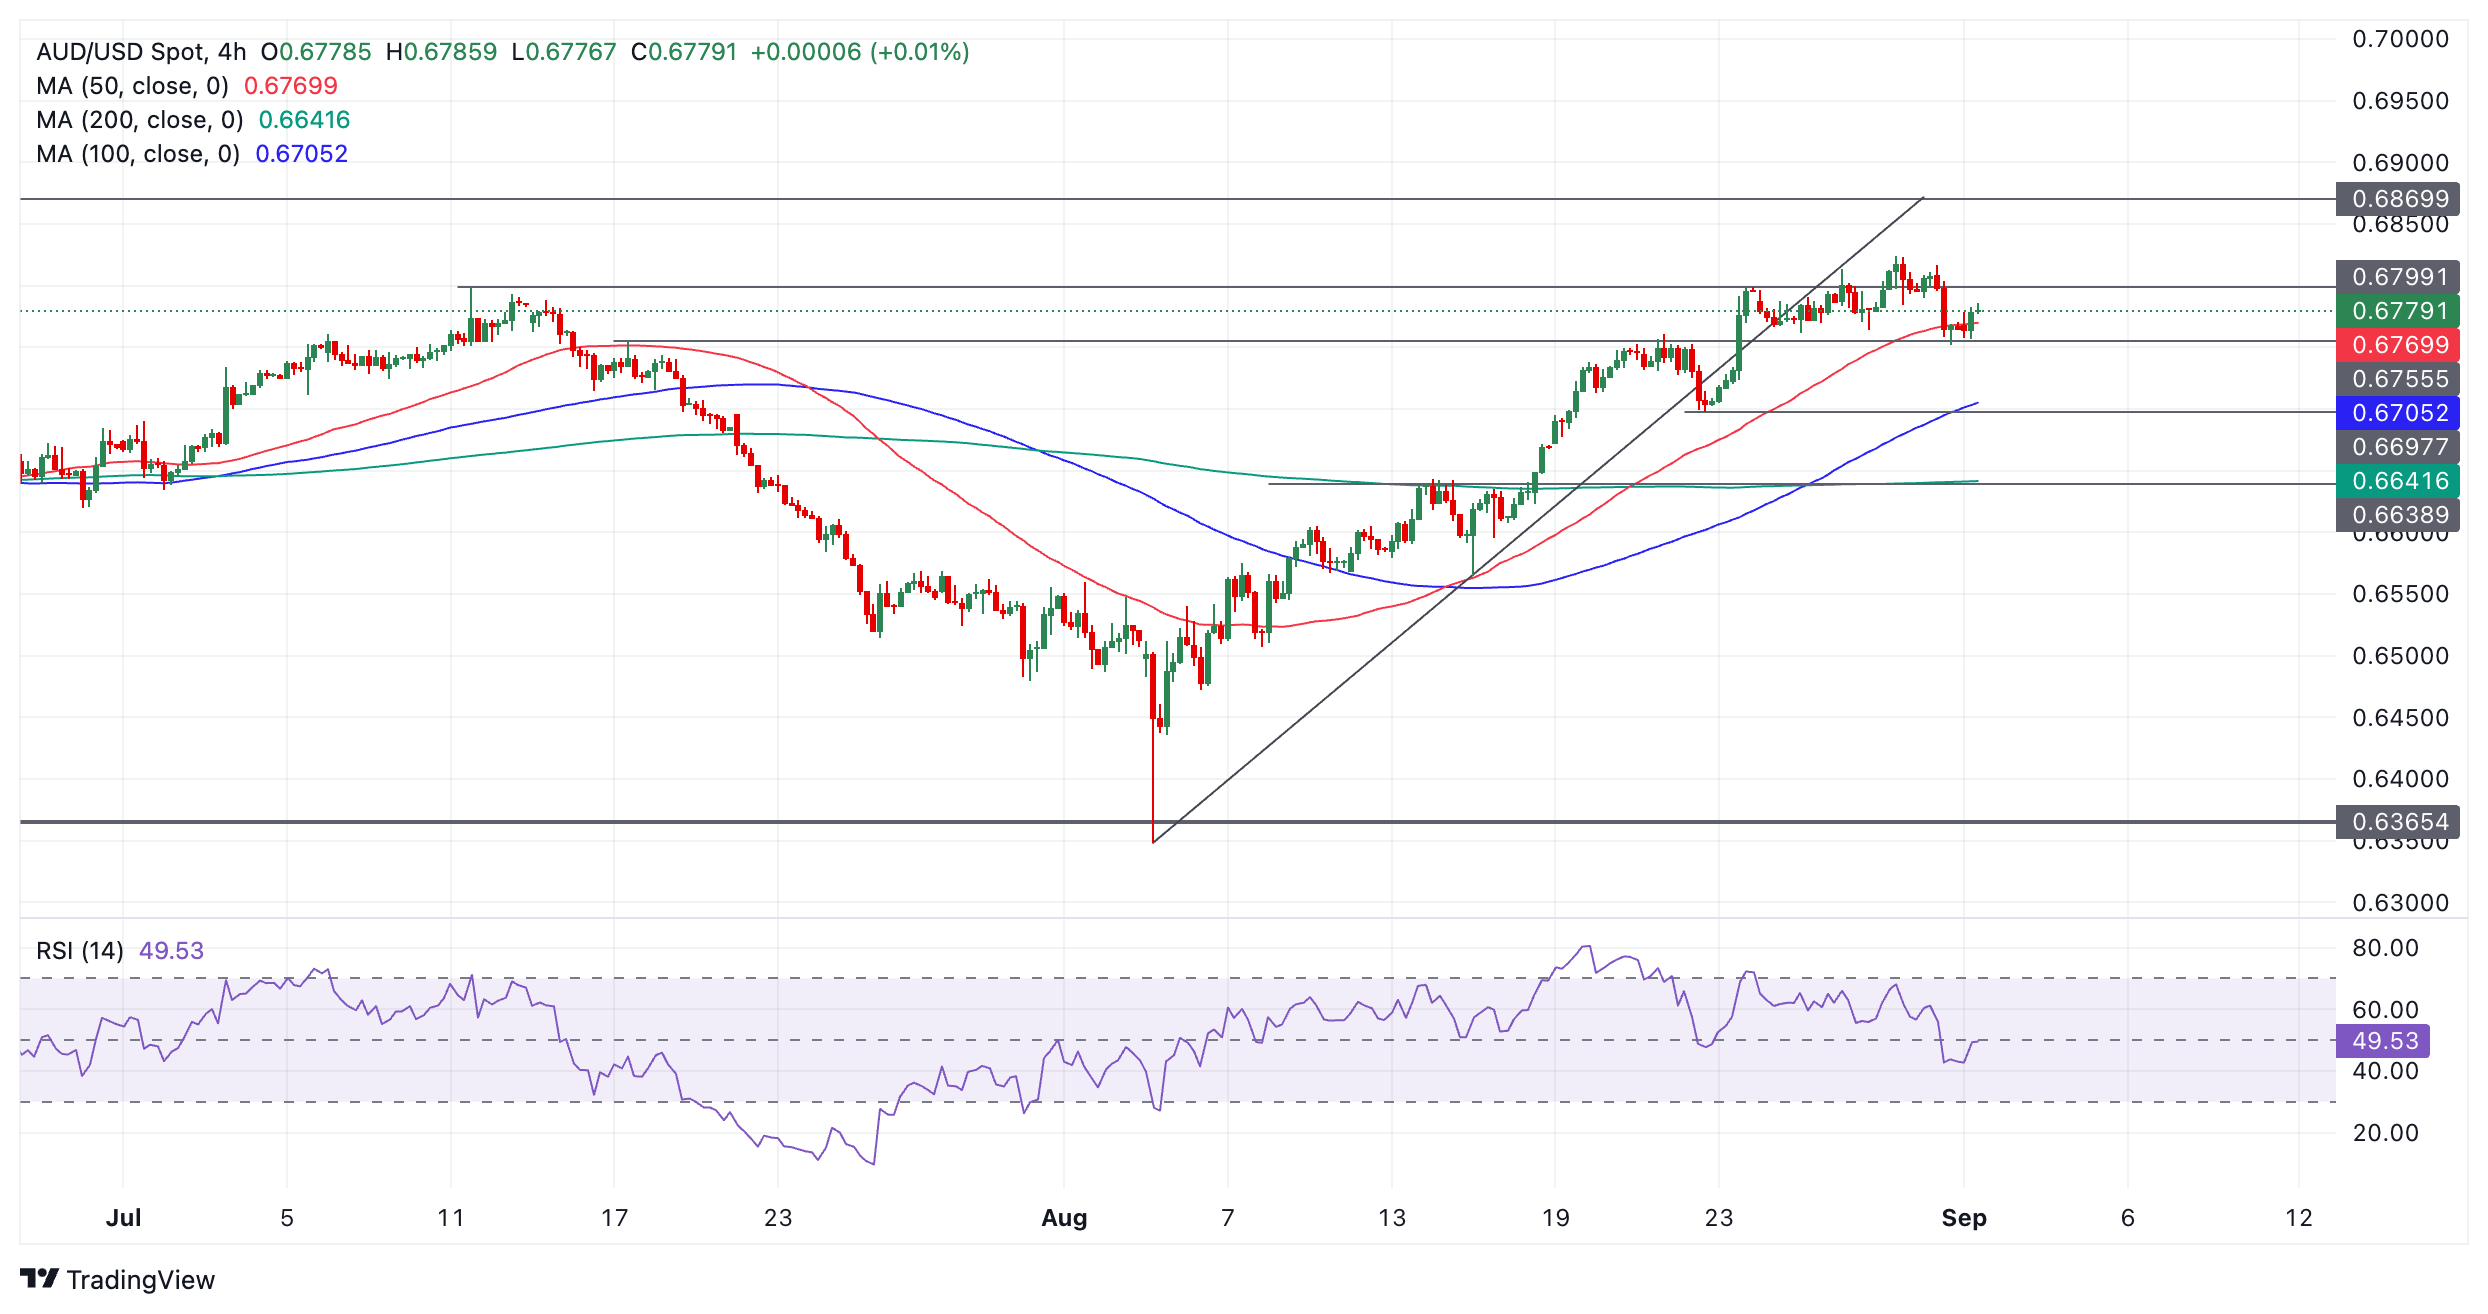
An extension lower, however, would bring into question this hypothesis and possibly suggest the correction might actually be the start of a new downtrend.
For confirmation price would need to close below 0.6751, (low of August 30). That would likely be followed by a move down to 0.6700-05 and the 200-period Simple Moving Average (SMA).
AUD/USD is a broad sideways range and it has retested resistance at the top of the range like it did in July. This could be another indication the short-term trend may be about to change and price could start declining again.
The Relative Strength Index (RSI) momentum indicator is in the lower half of its range. It is showing quite strong bearish momentum accompanied the pull back from the August 29 high.
More By This Author:
EUR/JPY Rises After Eurozone Inflation Data Lands As Forecast
Gold Rises On Nvidia Disappointment, Revival Of China Demand
EUR/GBP Price Analysis: Bears Push Pair Near 0.8400, Outlook Negative


Comments
Log in or sign up to join the conversation.