
AUD/USD keeps posting green candlesticks as it steadily creeps higher. The pair hit a new 2024 high of 0.6839 on Thursday and although there is not much spare room left above until it touches the long-term range high at 0.6870, the trend is short-term bullish, so it’s quite possible it could continue higher.
AUD/USD Daily Chart
(Click on image to enlarge)
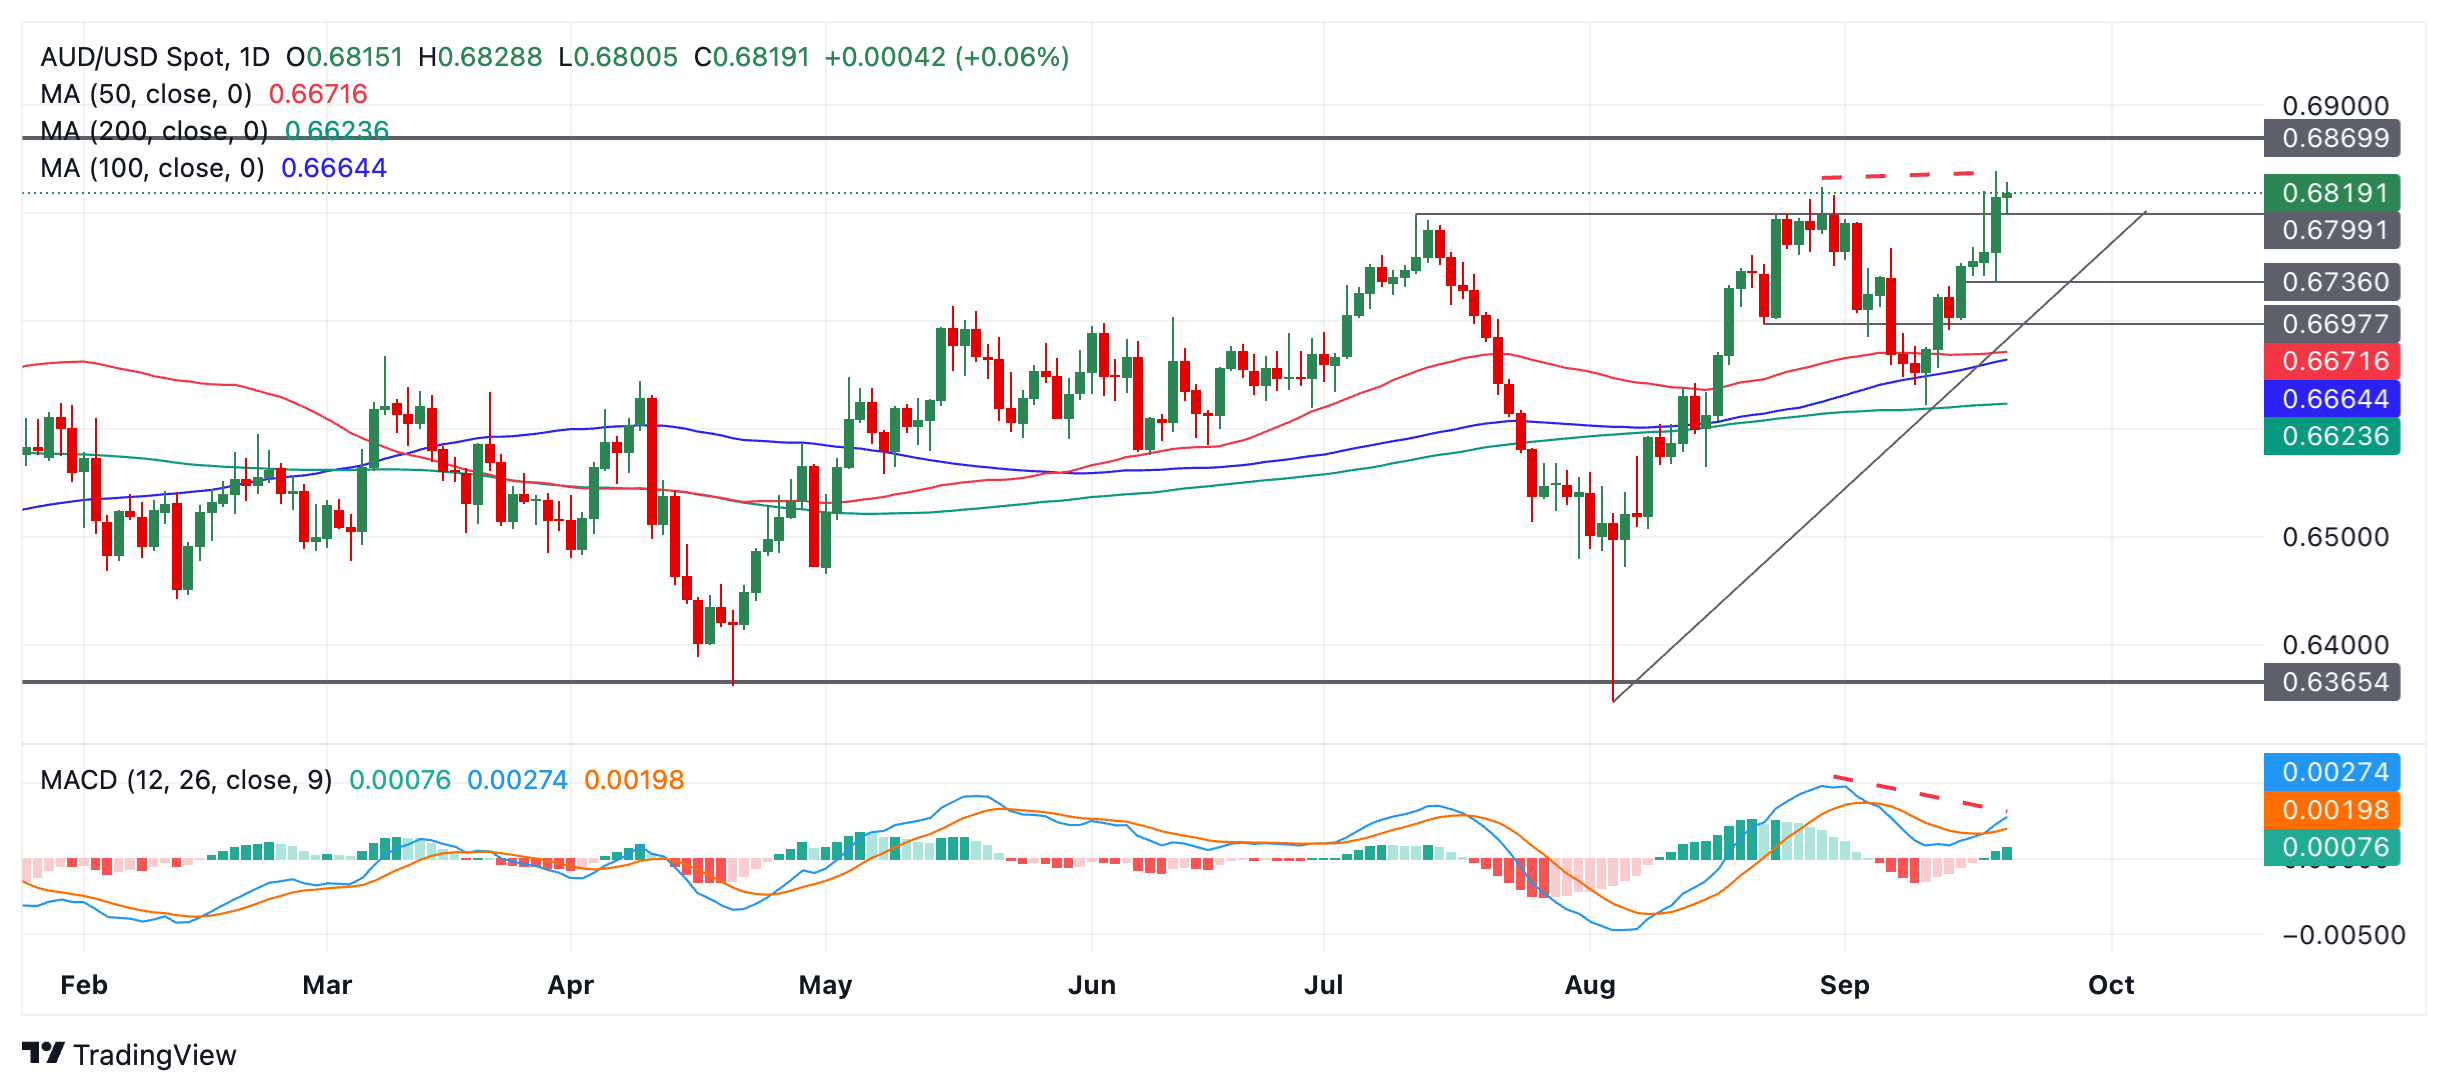
The Aussie is showing mild bearish divergence with the Relative Strength Index (RSI) momentum indicator (red dashed lines on chart above). This occurs when the price reaches a new high but the RSI fails to. The non confirmation is a bearish sign and indicates mild underlying weakness. It suggests AUD/USD is at risk of pulling back.
If a correction evolves it is likely to find support at around 0.6800 (July high), followed by 0.6736.
AUD/USD is in a short-term uptrend since the September 11 low and given it is a principle of technical analysis that “the trend is your friend” the odds favor a continuation higher eventually – despite the bearish divergence with RSI.
A break above the 0.6839 (September 19 and yearly high) would confirm a continuation of the uptrend to a target at the 0.6870 level (December 2023 high).
More By This Author:
Gold Price Consolidates Near Record High, Bullish Potential Seems IntactWTI Advances To $71.00 Mark, Over Two-Week High Amid Broad-Based USD Weakness
Gold Price Regains Positive Traction Amid A Modest USD Pullback From One-Week High


Comments
Log in or sign up to join the conversation.