
The AUD/USD pair trades sideways in a narrow range slightly above the psychological support of 0.6500 in the early New York session on Monday. The Aussie asset consolidates as investors seek fresh guidance on when the Reserve Bank of Australia (RBA) and the Federal Reserve (Fed) will pivot to rate cuts.
The S&P 500 opens on a cautious note after a holiday-stretched weekend due to Good Friday. The US Dollar Index (DXY) moves higher to 104.65 amid a cautious market mood. Investors turn cautious ahead of the United States Nonfarm Payrolls (NFP) data for March, which will be published on Friday.
Firm market expectations for the Federal Reserve (Fed) to cut interest rates keep the upside of the US Dollar capped. Fed Chair Jerome Powell’s commentary that there is no need to rush for rate cuts restricts the downside.
On the Australian Dollar front, investors await the Reserve Bank of Australia (RBA) monetary policy minutes, which will be published on Tuesday. The policy minutes will provide a detailed explanation behind the steady interest rate decision on March 19.
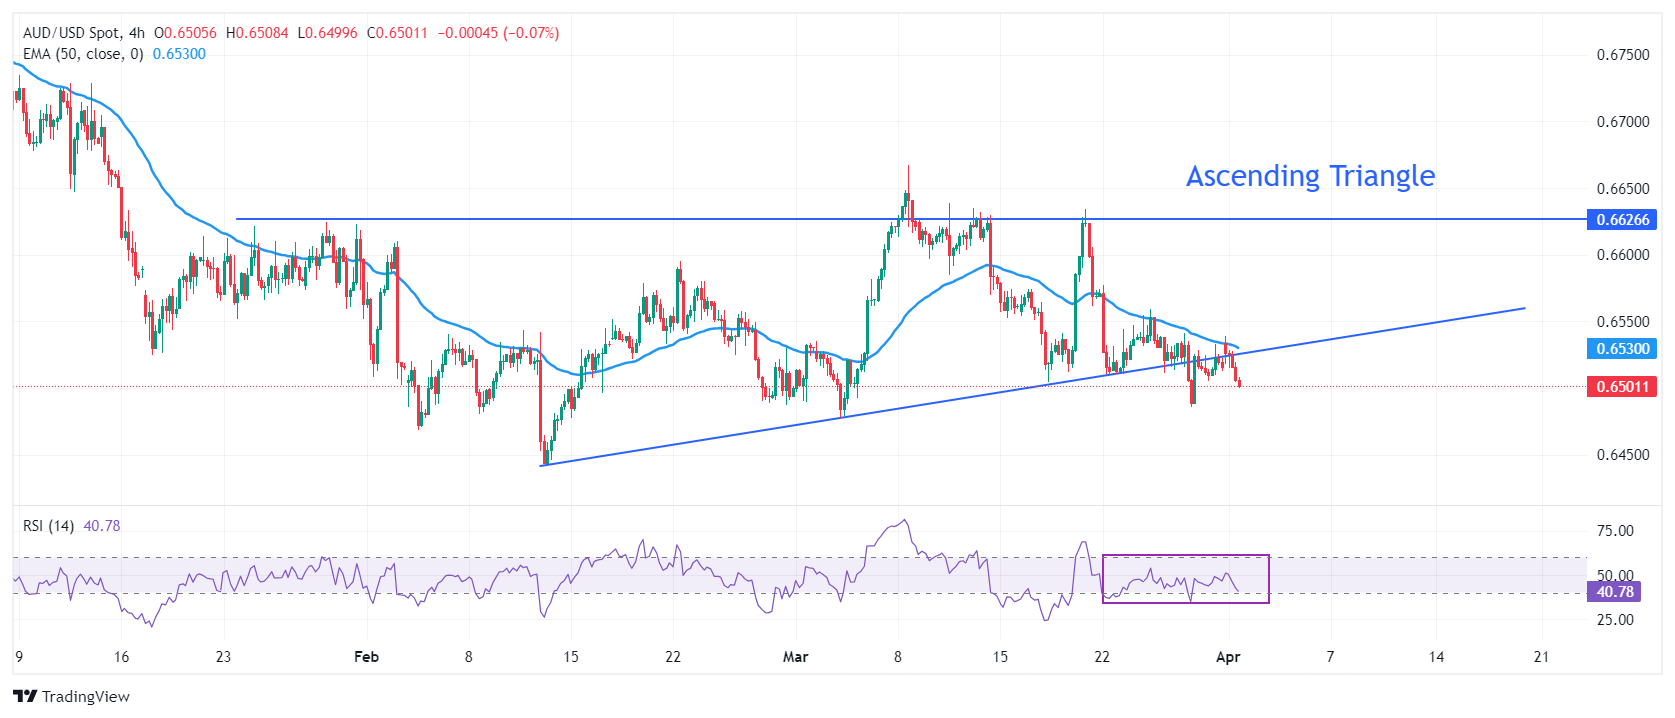
AUD/USD delivers a breakdown of the Ascending Triangle chart pattern near 0.6520 formed on a four-hour timeframe. The upward-sloping border of the aforementioned pattern is plotted from February 13 low at 0.6442 while the horizontal resistance is placed from January 30 high at 0.6626.
Downward-sloping 50-period Exponential Moving Averages (EMA) at 0.6530, indicates that the near-term demand is weak.
The 14-period Relative Strength Index (RSI) oscillates in the 40.00-60.00 range, indicating indecisiveness among market participants.
Investors might build fresh shorts below March 28 low at 0.6485. Profits on shorts would be booked near February 13 low around 0.6440 and the round-level support of 0.6400.
On the contrary, a sharp recovery move above March 26 high at 0.6560 will drive the asset toward the round-level resistance of 0.6600, followed by March 12 high at 0.6640.
AUD/USD four-hour chart
(Click on image to enlarge)
AUD/USD
| OVERVIEW | |
|---|---|
| Today last price | 0.6508 |
| Today Daily Change | -0.0008 |
| Today Daily Change % | -0.12 |
| Today daily open | 0.6516 |
| TRENDS | |
|---|---|
| Daily SMA20 | 0.656 |
| Daily SMA50 | 0.6548 |
| Daily SMA100 | 0.6599 |
| Daily SMA200 | 0.6548 |
| LEVELS | |
|---|---|
| Previous Daily High | 0.6533 |
| Previous Daily Low | 0.6505 |
| Previous Weekly High | 0.6559 |
| Previous Weekly Low | 0.6486 |
| Previous Monthly High | 0.6667 |
| Previous Monthly Low | 0.6478 |
| Daily Fibonacci 38.2% | 0.6516 |
| Daily Fibonacci 61.8% | 0.6523 |
| Daily Pivot Point S1 | 0.6503 |
| Daily Pivot Point S2 | 0.649 |
| Daily Pivot Point S3 | 0.6475 |
| Daily Pivot Point R1 | 0.6531 |
| Daily Pivot Point R2 | 0.6546 |
| Daily Pivot Point R3 | 0.6559 |
More By This Author:
EUR/USD Faces Pressure Near 1.0800 Ahead Of Data-Packed Week
AUD/USD Price Analysis: Likely test Ascending Triangle’s breakdown near 0.6520
Gold price holds strength ahead of US core PCE inflation


Comments
Log in or sign up to join the conversation.