
The AUD/USD pair finds support slightly below the psychological support of 0.6500 in the early American session on Thursday. The Aussie asset discovers some buying interest as the US Dollar retreats after refreshing six-week high. However, the broader appeal of the Aussie asset is still downbeat as investors remain uncertain ahead of the United States core Personal Consumption Expenditure Price Index (PCE) data for February, which will be published on Friday.
The core PCE will provide cues about when the Federal Reserve (Fed) will begin reducing interest rates. The annual underlying inflation data is estimated to have grown steadily by 2.8%, with monthly growth declining to 0.3% from 0.4% in January.
The US Dollar Index failed to sustain six-week highs near 104.72 despite the final estimate from the US Bureau of Economic Analysis (BEA) for the final quarter of 2023 showing that the economy grew by 3.4%. As per the preliminary estimates, the economy expanded by 3.2%.
Meanwhile, the Australian Dollar broadly remains on the backfoot as the Reserve Bank of Australia's (RBA) higher Official Cash Rate (OCR) has deepened the cost-of-living crisis. The Australian Bureau of Statistics reported that monthly Retail Sales grew at a slower pace of 0.3% in February, against expectations of 0.4% and the former reading of 1.1%.
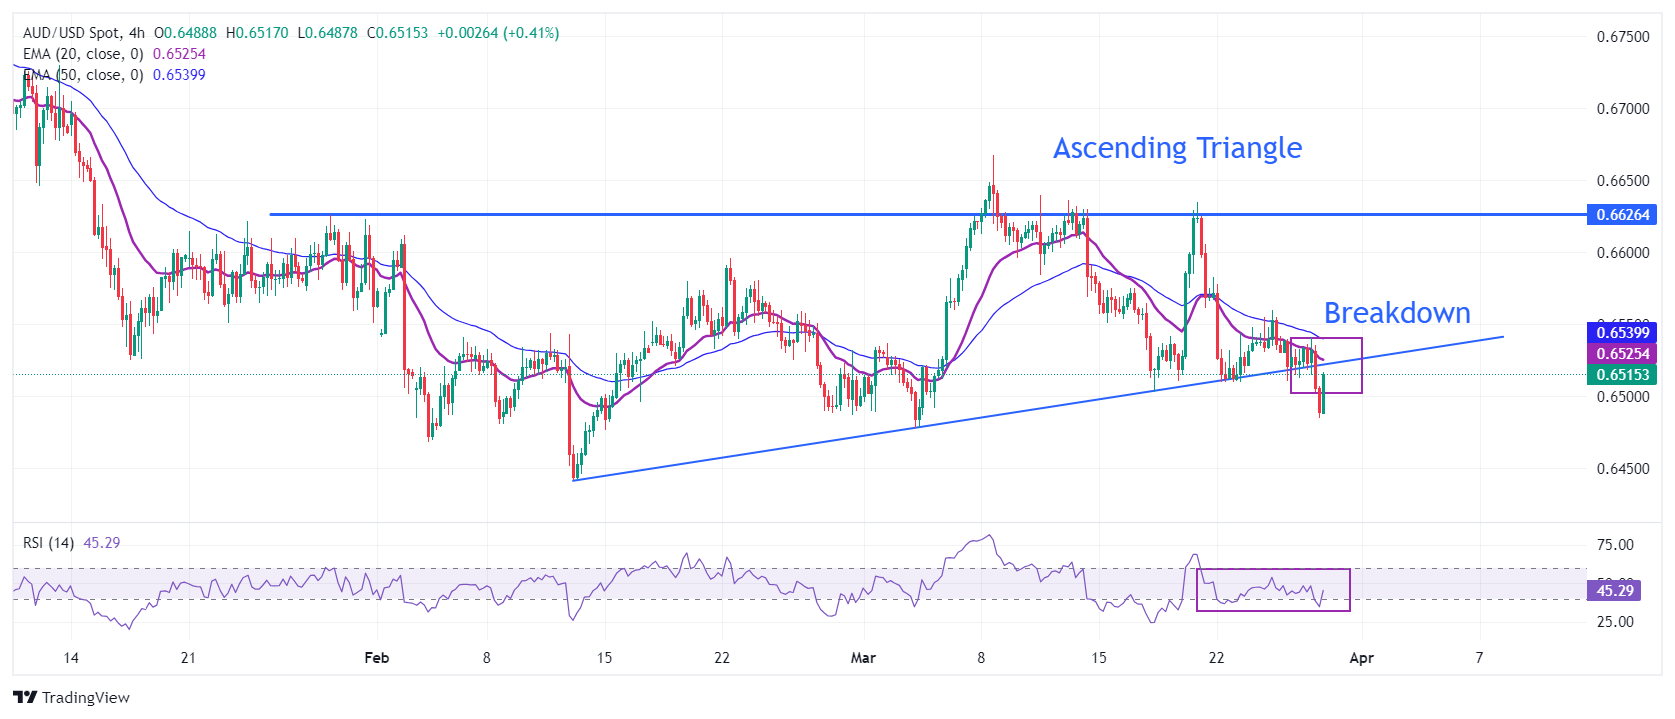
AUD/USD is expected to test the breakdown of the Ascending Triangle chart pattern near 0.6520 formed on a four-hour timeframe. The upward-sloping border of the aforementioned pattern is plotted from February 13 low at 0.6442 while the horizontal resistance is placed from January 30 high at 0.6626.
Downward-sloping 20- and 50-period Exponential Moving Averages (EMAs) at 0.6525 and 0.6538, respectively, indicate that near-term demand is weak.
The 14-period Relative Strength Index (RSI) oscillates inside the 40.00-60.00 range, indicating indecisiveness among market participants.
Investors might build fresh shorts after a pullback move near 0.6530. Profits on shorts would be booked near the psychological support of 0.6500 and February 13 low near 0.6440.
On the contrary, a sharp recovery move above March 26 high at 0.6560 will drive the asset toward the round-level resistance of 0.6600, followed by March 12 high at 0.6640.
AUD/USD four-hour chart
(Click on image to enlarge)
AUD/USD
| OVERVIEW | |
|---|---|
| Today last price | 0.6514 |
| Today Daily Change | -0.0020 |
| Today Daily Change % | -0.31 |
| Today daily open | 0.6534 |
| TRENDS | |
|---|---|
| Daily SMA20 | 0.656 |
| Daily SMA50 | 0.6551 |
| Daily SMA100 | 0.6596 |
| Daily SMA200 | 0.655 |
| LEVELS | |
|---|---|
| Previous Daily High | 0.6539 |
| Previous Daily Low | 0.6511 |
| Previous Weekly High | 0.6634 |
| Previous Weekly Low | 0.6504 |
| Previous Monthly High | 0.661 |
| Previous Monthly Low | 0.6443 |
| Daily Fibonacci 38.2% | 0.6528 |
| Daily Fibonacci 61.8% | 0.6522 |
| Daily Pivot Point S1 | 0.6518 |
| Daily Pivot Point S2 | 0.6501 |
| Daily Pivot Point S3 | 0.649 |
| Daily Pivot Point R1 | 0.6545 |
| Daily Pivot Point R2 | 0.6556 |
| Daily Pivot Point R3 | 0.6573 |
More By This Author:
Gold price holds strength ahead of US core PCE inflationEUR/GBP Retreats From 0.8570 On Weak German Retail Sales
AUD/USD Advances To 0.6550 As US Dollar Eases, Australian Inflation In Focus


Comments
Log in or sign up to join the conversation.