
Wednesday’s AUD/USD price analysis is bullish as the dollar trades within a narrow range, pressured by dovish comments from Federal Reserve officials. Meanwhile, traders eagerly anticipate the release of the Fed’s policy meeting minutes later to gain further insights into its stance on interest rates. Additionally, US inflation data will come out on Thursday.
Several Fed officials have recently indicated that the need for tightening monetary policy might not be as significant as initially thought.
Meanwhile, the Australian dollar climbed to a more than one-week high, while the New Zealand dollar reached a two-month peak. This surge was partly due to reports suggesting China was considering new stimulus measures. However, the pairs later reversed these gains. The Australian and New Zealand dollars are liquid proxies for the yuan.
According to Bloomberg News, China is looking to increase its budget deficit for 2023 as part of a new round of stimulus to support the economy. However, there remains caution in the markets regarding the likelihood of substantial stimulus. This is because of the government’s reluctance in the past year.
CBA’s Kong remarked, “Markets are still pretty cautious about whether or not the government will introduce a large-scale stimulus. They have been reluctant this past year to unleash any large-scale stimulus. Therefore, markets are slightly unsure whether that report is real.”
If the report proves accurate and Chinese officials introduce a substantial stimulus package, it could boost the yuan and currencies tied to the Chinese economy.
AUD/USD key events today
Investors expect data from the US on:
- Wholesale inflation
- The Fed policy meeting minutes.
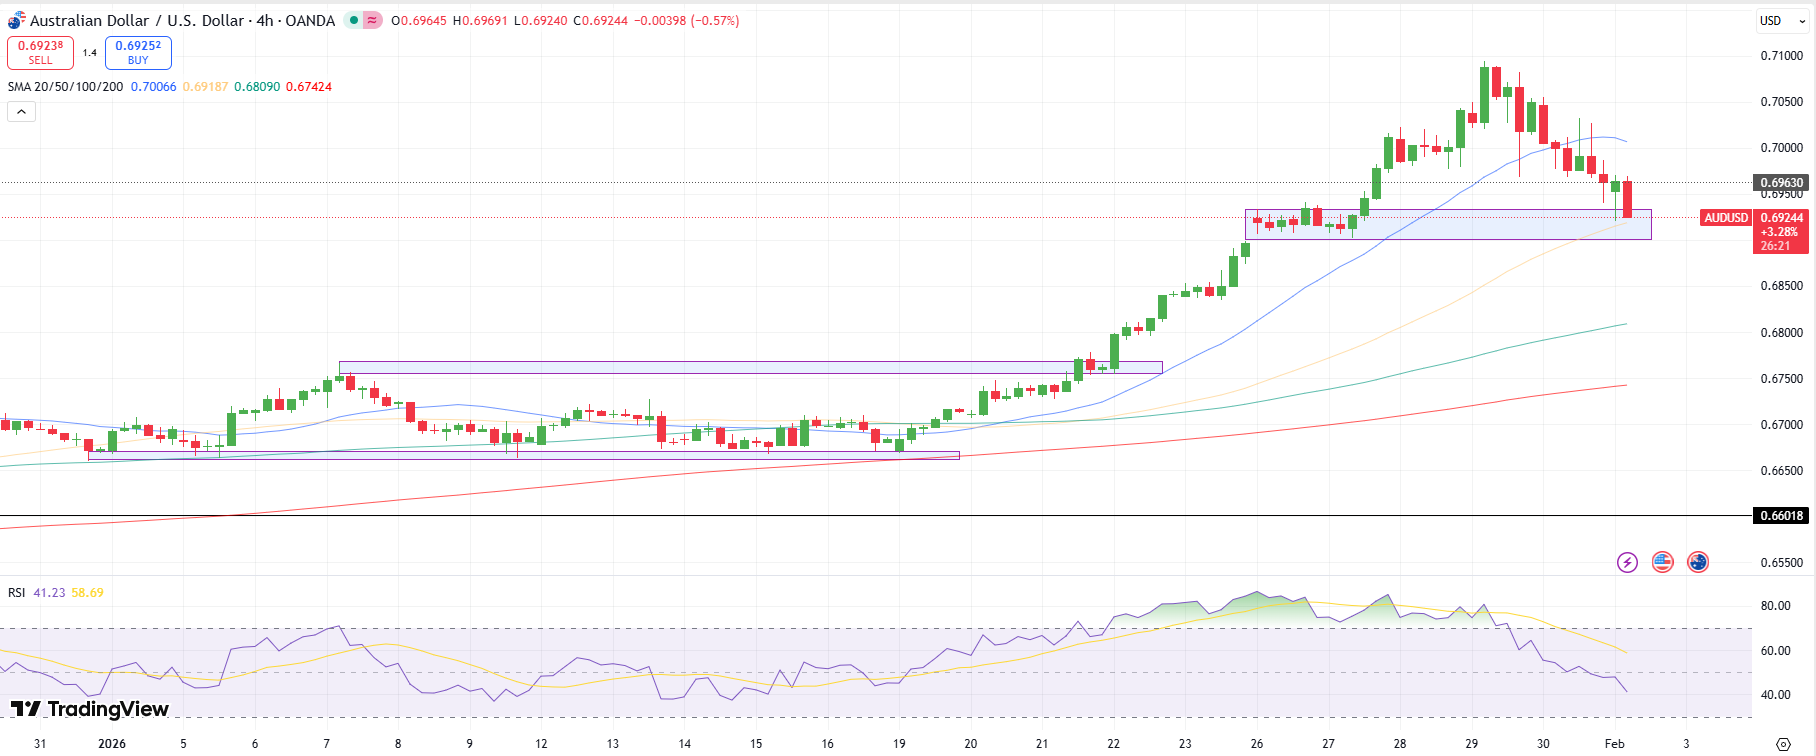
AUD/USD technical price analysis: Bulls push towards 0.6502 resistance.

AUD/USD 4-hour chart
On the technical side, the AUD/USD price rises after breaking above and retesting the 0.6400 resistance level. The price trades far above the 30-SMA, and the RSI sits above 50, bullish the bias on the 4-hour chart.
However, on a larger scale, it is clear that the price has made lower highs and lower lows, indicating a downward move. This could limit the upside potential for the current bullish move. Still, bulls are eyeing the 0.6502 resistance level. A break above this resistance would confirm a bullish takeover on a larger scale.
More By This Author:
USD/CAD Forecast: Oil Rally Keeping Pressure Under 1.36Gold Price Challenging Key Level Ahead Of US PPI, Fed
USD/JPY Price Gains Above 149 Amid Safe-Haven Appeal

Comments
Log in or sign up to join the conversation.