
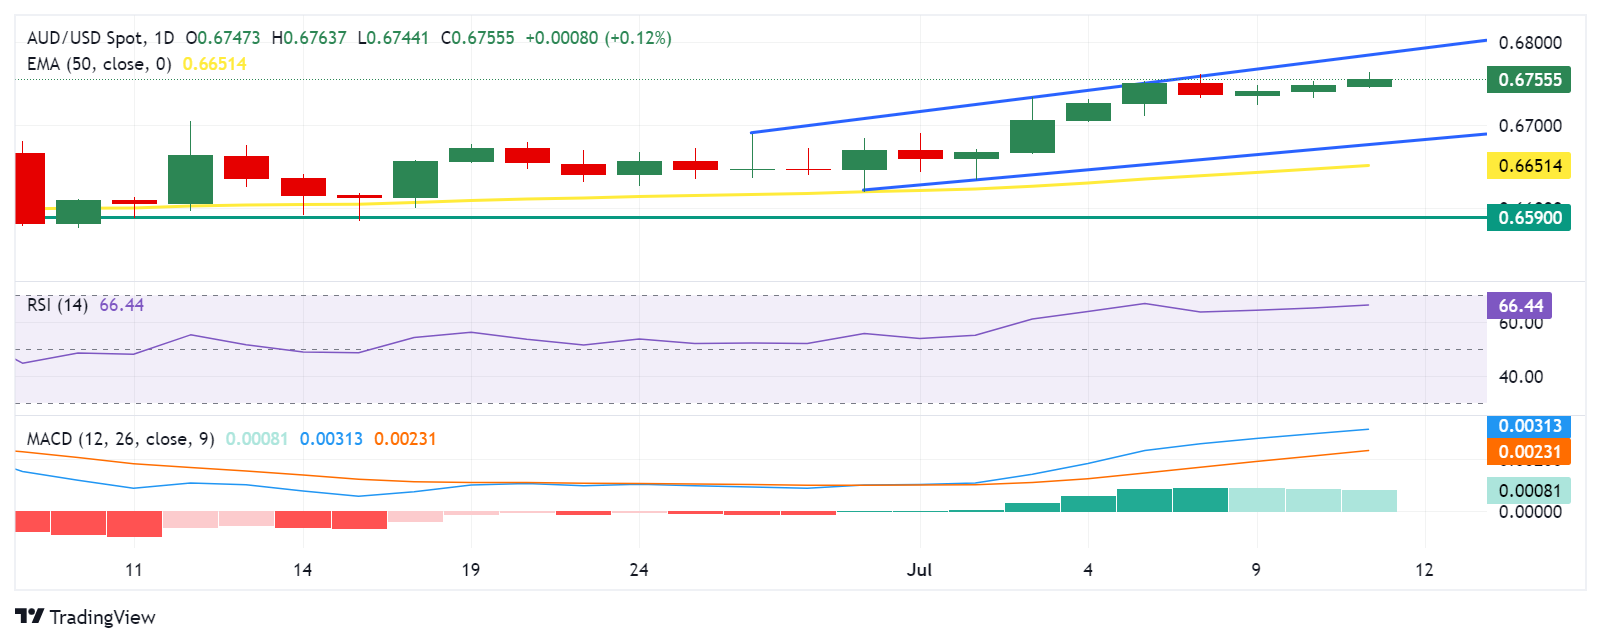
AUD/USD extends its losses for the third successive day, trading around 0.6760 during the European hours on Thursday. The analysis of the daily chart shows that the AUD/USD pair consolidates within an ascending channel, indicating a bullish bias in the pair's price action.
Additionally, the 14-day Relative Strength Index (RSI) is positioned slightly below the 70 level, indicating confirmation of the bullish trend while also suggesting potential overbought conditions. A breach above this level could signal a need for caution, possibly indicating a forthcoming correction.
Furthermore, the momentum indicator Moving Average Convergence Divergence (MACD) line is above the centerline, suggesting upward price movement. Divergence above the signal line further confirms this bullish trend, as it indicates increasing positive momentum.
The AUD/USD pair may test the upper boundary of the ascending channel at approximately 0.6785. If it breaks through this level, the pair could target the psychological level of 0.6800.
On the downside, the AUD/USD pair may find support around the lower boundary of the ascending channel at the 0.6675 level, with additional support near the 50-day Exponential Moving Average (EMA) at 0.6651. A break below this level could push the pair toward the throwback support around 0.6590.
AUD/USD: Daily Chart
(Click on image to enlarge)
More By This Author:
Australian Dollar Extends Gains Due To The Hawkish Sentiment Surrounding RBAUSD/CAD Holds Ground Around 1.3650 Due To Lower Oil Prices, Hawkish Fed
EUR/JPY Price Analysis: Holds Position Around 174.50 With An Overbought Condition


Comments
Log in or sign up to join the conversation.