
AUD/USD Post-RBA Recovery Remains Intact Ahead Of US NFP Report
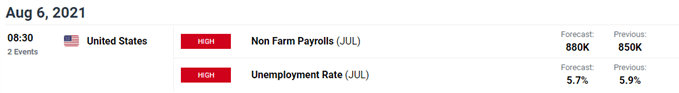
AUD/USD trades near the weekly high (0.7425) as the ADP Employment report shows a 330K rise in July versus forecasts for a 695K expansion, and the exchange rate may continue to retrace the decline from the previous month if the updated NFP figures also reflect a slower-than-expected pickup in job growth.
Lackluster data prints coming out of the US economy may continue to drag on the US Dollar as it encourages the Federal Reserve to retain the current course for monetary policy, and the central bank may continue to carry out a wait-and-see approach as Chairman Jerome Powell and Co. brace for a transitory rise in inflation.
Until then, the Greenback may face headwinds as Governor Lael Brainard, a permanent voting member on the Federal Open Market Committee (FOMC), acknowledges that “employment has some distance to go,” but a further recover in AUD/USD may lead to a shift in retail sentiment like the behavior seen earlier this year.
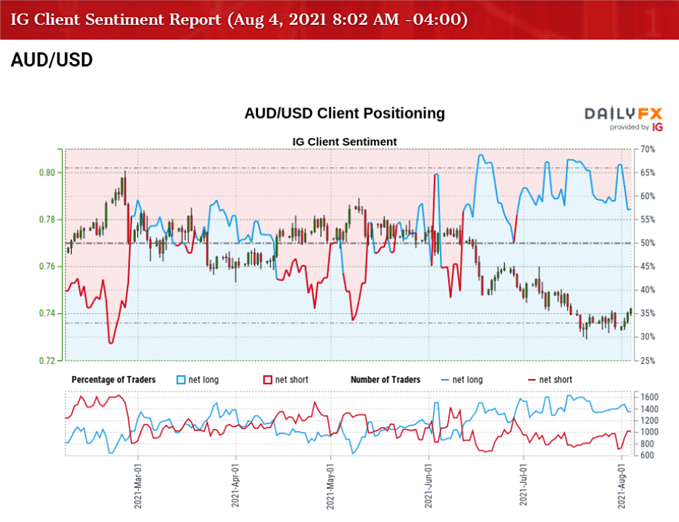
The IG Client Sentiment Report shows 55.99% of traders are currently net-long AUD/USD, with the ratio of traders long to short standing at 1.27 to 1.
The number of traders net-long is 7.19% lower than yesterday and 6.17% lower from last week, while the number of traders net-short is 5.70% higher than yesterday and 9.35% higher from last week. The decline in net-long interest has alleviated the crowding behavior as 61.73% of traders were net-long AUD/USD last week, while the rise in net-short position comes as the exchange rate extends the series of higher highs and lows from the start of the week.
With that said, the decline from the February high (0.8007) may turn out to be a change in the broader trend as AUD/USD slipped to a fresh yearly low (0.7410) in July, but recent developments in the Relative Strength Index (RSI) indicate a larger recovery in the exchange rate as the oscillator breaks out of the downward trend from earlier this year.
AUD/USD RATE DAILY CHART
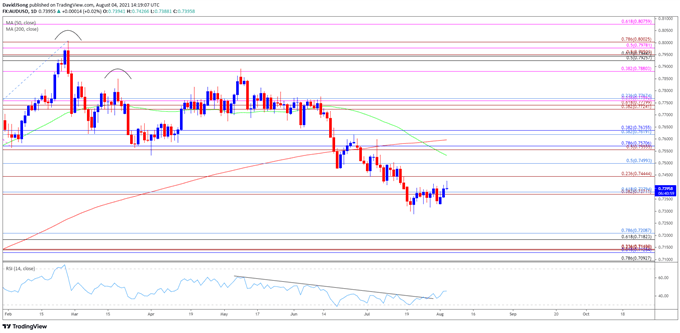
Source: Trading View
- Keep in mind, a head-and-shoulders formation took shape earlier this year as AUD/USD traded to a fresh 2021 low (0.7532) in April, but the exchange rate negated the key reversal pattern following the failed attempts to close below the neckline around 0.7560 (50% expansion) to 0.7570 (78.6% retracement).
- However, there appears to be a shift in the broader trend as AUD/USD sits below the 200-Day SMA (0.7596) for the first time in over a year, with the decline in the exchange rate pushing the Relative Strength Index (RSI) into oversold territory for the first time since March 2020.
- Nevertheless, recent developments in the RSI indicate a larger recovery in AUD/USD as it breaks out of the downward trend carried over from earlier this year, with the recent series of higher highs and lows in the exchange rate keeping the Fibonacci overlap around 0.7440 (23.6% expansion) to 0.7500 (50% retracement) on the radar.
- Next area of interest comes in around 0.7560 (50% expansion) to 0.7570 (78.6% retracement), with a move above the 200-Day SMA (0.7596)opening up the 0.7620 (38.2% retracement) to 0.7640 (38.2% retracement) region.
Disclosure: See the full disclosure for DailyFX here.


