AUD/USD Forex Signal: Double-Top Pattern Points To More Weakness
Bearish view
- Sell the AUD/USD pair and set a take-profit at 0.6600.
- Add a stop-loss at 0.6750.
- Timeline: 1-2 days.
Bullish view
- Buy the AUD/USD pair and set a take-profit at 0.6750.
- Add a stop-loss at 0.6600.
(Click on image to enlarge)
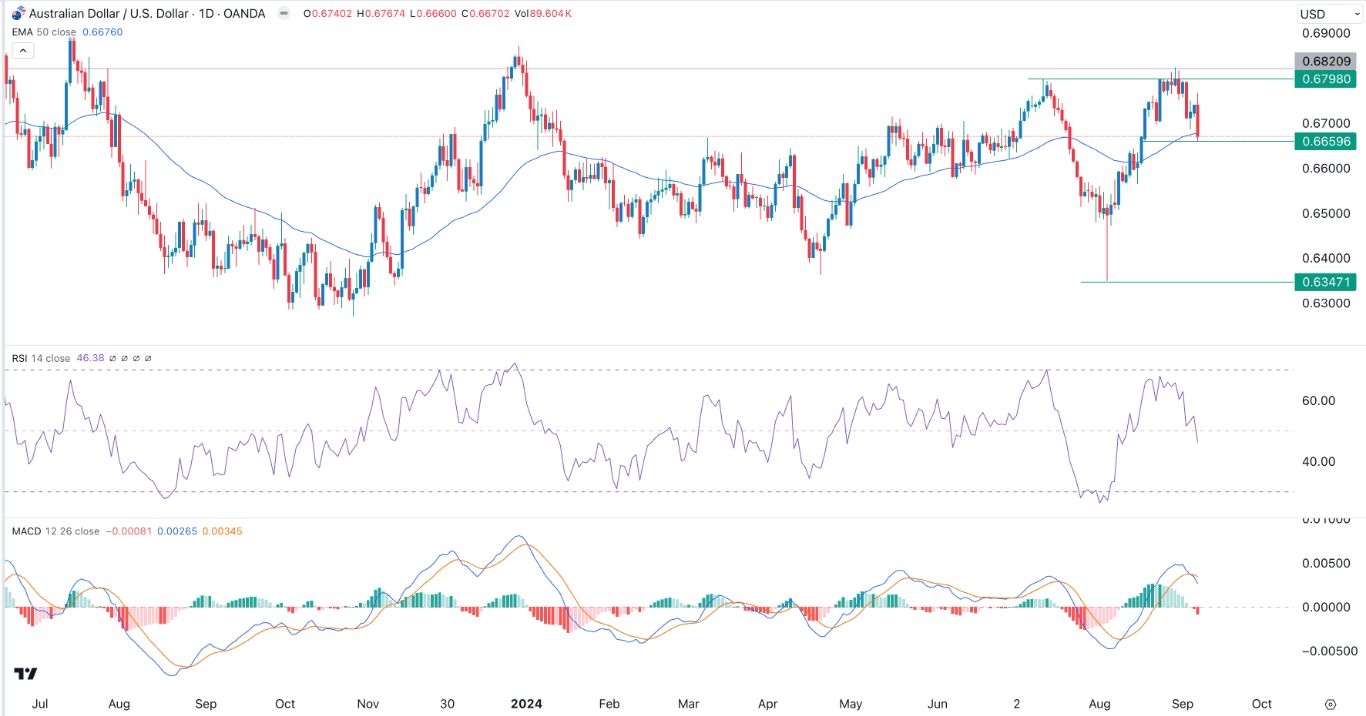
The AUD/USD currency pair retreated sharply as the US dollar bounced back after last Friday’s non-farm payrolls (NFP) data. It crashed to a low of 0.6660, its lowest swing since August 16, down by over 2.27% from its highest point in August.
RBA and Federal Reserve outlooks
The AUD/USD exchange rate retreated sharply after the US jobs numbers pointed to a smaller rate cut than expected. The report showed that the economy created 142k jobs in August, missing the analysts’ estimate of 164k.
Additional data showed that the unemployment rate dropped from 4.3% to 4.2% while the average hourly earnings rose by 3.8%, higher than the expected 3.7%. Therefore, the view is that the Fed will cut rates by 0.25%, lower than the expected 0.50%.
The Reserve Bank of Australia (RBA), on the other hand, is expected to hold interest rates steady longer than expected. In recent statements, the bank has hinted that it will hike rates later this year.
The AUD/USD pair also retreated as hedge funds trimmed their bearish bets on the currency. According to the Commodity Futures Trading Commission (CFTC), these bets moved to 7.9k last week, and is about to turn positive for the first time since July.
The main data to watch will be the upcoming US inflation data on Wednesday. Analysts expect the report to show that inflation continued falling in August as energy prices dropped.
The other important numbers to watch will be Australia’s consumer and business confidence report and the country’s inflation expectation data.
AUD/USD technical analysis
The Australian dollar bottomed at 0.6347 in August as the Japanese yen carry trade unfolded. It then staged a strong comeback, peaking at 0.6820, its highest point since January this year.
The pair formed a double-top chart pattern, a popular bearish sign in the market, which explains why it has pulled back in the past few days.
It has remained slightly above the 50-day moving average while the Relative Strength Index (RSI) has crossed the neutral point at 50 and pointing downwards. The two lines of the MACD indicator have also formed a bearish crossover.
Therefore, the pair will likely continue falling as sellers target the next key support at 0.6600 as traders wait for the US inflation report.
More By This Author:
AUD/USD Forex Signal: Stabilizes Ahead Of US NFP And Services PMI DataBTC/USD Forex Signal: Consolidation Continues As Traders Eye Next Catalyst
BTC/USD Forex Signal: More Downside Expected As Sentiment Wanes
Disclosure: DailyForex will not be held liable for any loss or damage resulting from reliance on the information contained within this website including market news, analysis, trading signals ...
more


