AUD/USD Forex Signal: Bearish Price Channel
The FOMC release towards the end of today’s New York session may cause volatility in the US Dollar, so traders should be careful as that time approaches.
My previous signal on 5th December was not triggered, as there was insufficiently strong price action at both key support and resistance levels which were reached that day.
Today’s AUD/USD Signals
Risk 0.75%
Trades may only be taken before 5pm Tokyo time Wednesday.
Short Trade Ideas
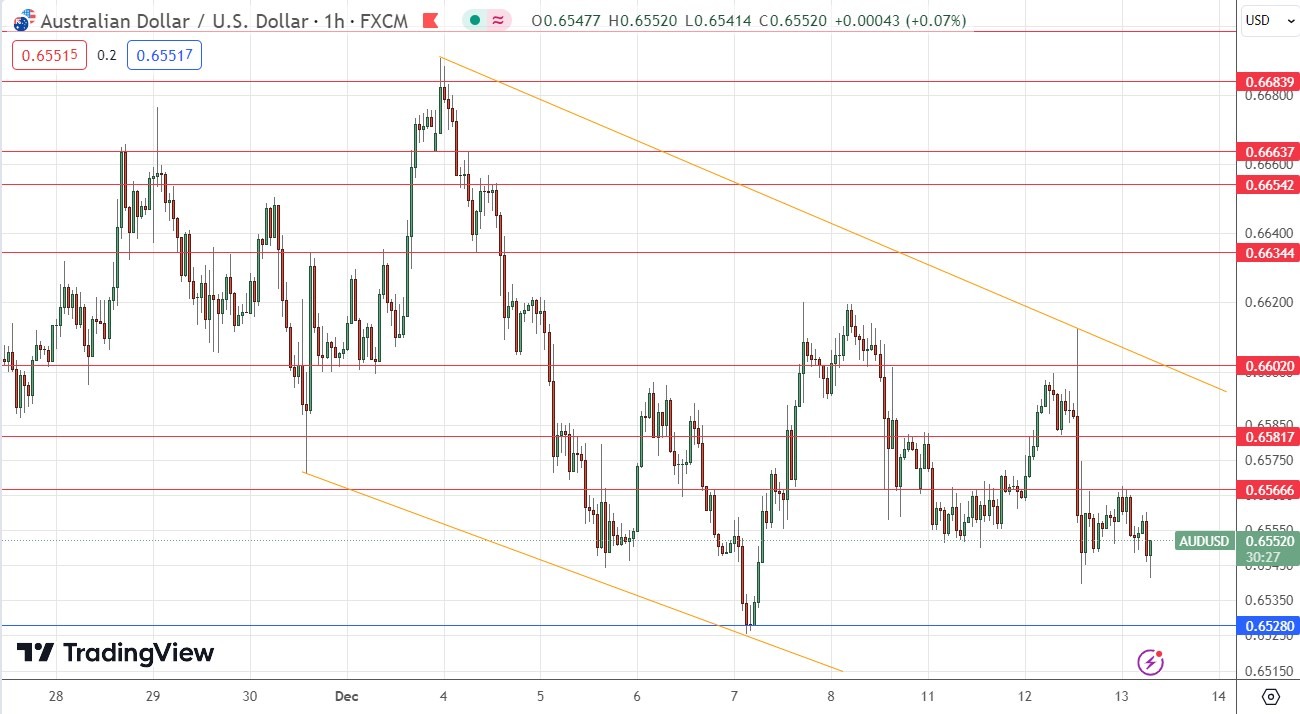
- Short entry following a bearish price action reversal on the H1 time frame immediately upon the next touch of $0.6567, $0.6582, or $0.6602.
- Put the stop loss 1 pip above the local swing high.
- Adjust the stop loss to break even once the trade is 20 pips in profit.
- Take off 50% of the position as profit when the price reaches 20 pips in profit and leave the remainder of the position to run.
Long Trade Ideas
- Long entry following a bullish price action reversal on the H1 time frame immediately upon the next touch of $0.6528 or $0.6456.
- Put stop loss 1 pip below the local swing low.
- Adjust the stop loss to break even once the trade is 20 pips in profit.
- Take off 50% of the position as profit when the price reaches 20 pips in profit and leave the remainder of the position to run.
The best method to identify a classic “price action reversal” is for an hourly candle to close, such as a pin bar, a doji, an outside or even just an engulfing candle with a higher close. You can exploit these levels or zones by watching the price action that occurs at the given levels.
AUD/USD Analysis
I wrote in my previous forecast on Tuesday last week that the AUD/USD currency pair was showing a more bearish technical picture. I thought if the support level at $0.6572 broke down, the price would continue lower to reach $0.6546. This was a good, accurate call. I was also correct that this latter level could be pivotal, as it marked the low of the day.
The technical picture remains bearish, despite US Dollar consolidation and a recovery in some stock markets, notably in the US where major indices are rising strongly to new long-term high prices.
We see the development of a wide and symmetrical bearish price channel which is exerting downwards pressure.
The resistance level at $0.6602 looks especially likely to be strong, as there is a confluence here of the upper descending trend line and a round number at $0.6600, as well as the horizontal level itself at $0.6602.
The price may be finding minor support. If it continues to fall without finding resistance first, there may be scope for a long scalp from $0.6528. I will be more attracted to a potential short trade following a bullish retracement to any of the resistance levels nearby.
The FOMC release towards the end of today’s New York session may cause volatility in the US Dollar, so traders should be careful as that time approaches.
(Click on image to enlarge)

More By This Author:
GBP/USD Forex Signal: Bullish Flag Points To A Bullish BreakoutEUR/USD Analysis: Temporary Stop Losses
Forex Today: Stocks Higher As Markets Await US Inflation Data
Disclosure: DailyForex will not be held liable for any loss or damage resulting from reliance on the information contained within this website including market news, analysis, trading signals ...
more


