
AUD/USD Analysis &Talking Points
- Positive Chinese economic data bolsters AUD.
- Michigan consumer sentiment in focus ahead of FOMC next week.
- AUD/USD trading at key inflection point, 0.67 at risk.
Australian Dollar Fundamental Backdrop
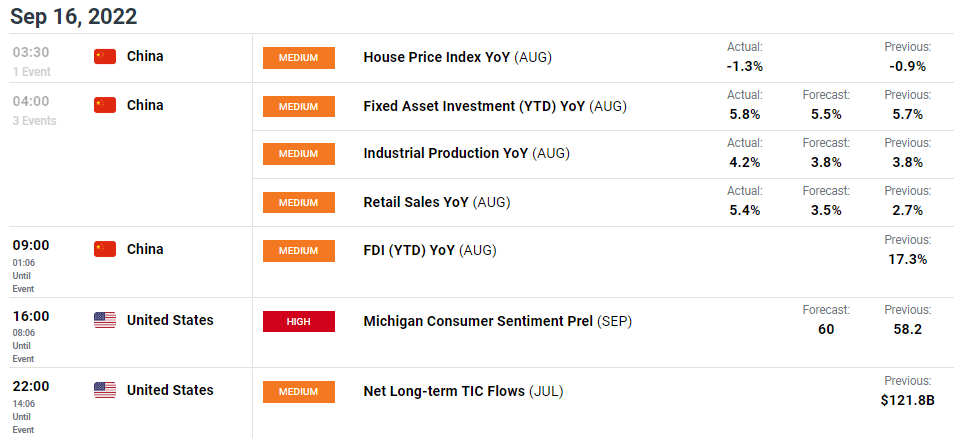
AUD found some support on Friday after better than expected Chinese data (see economic calendar below). Although the slew of economic data prints began on the backfoot with a decline in housing prices, retails sales and industrial production helped foster AUD bids against a rallying USD. China being Australia’s primary importer of commodities allowed for the positive transfer through to the local currency. That being said, Australian-linked commodity prices are mostly in the red today leaving any upside on the AUD/USD pair attributed to Chinese data.
The economic calendar is fairly light today with U.S. consumer sentiment dominating headlines. Estimates point to a fourth consecutive increase in sentiment which could extend USD upside as 100bps Federal Reserve rate hikes gain traction, leaving the Aussie vulnerable going into next weeks central bank themed week.
Long-term unless a marked turnaround in China transpires, the Aussie will remain under pressure as a ‘pro-growth’ currency particularly while the U.S. central bank continues its inflation fight with tighter monetary policy.
Economic Calendar
(Click on image to enlarge)
Technical Analysis
AUD/USD Daily Chart
(Click on image to enlarge)
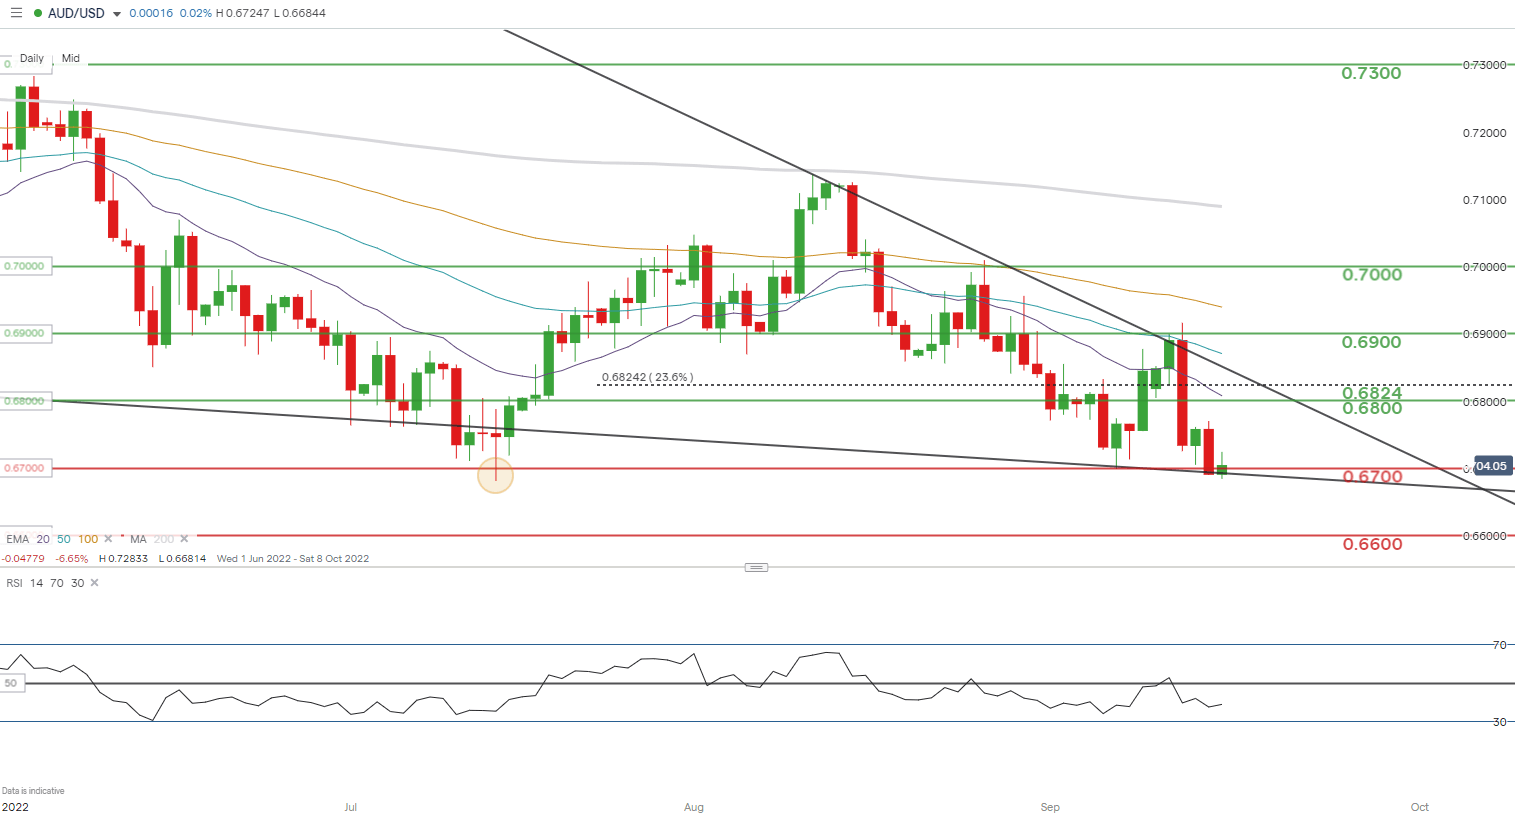
Chart prepared by Warren Venketas, IG
Daily AUD/USD price action testing July swing lows at 0.6681 (yellow) while simultaneously testing falling wedge support (black). A confirmed close below wedge support could invalidate the traditional upside bias associated with the falling wedge and expose the Aussie to subsequent support zones. In addition, the psychological 0.6700handle is under threat making the current trading region a key area of confluence.
Looking at the Relative Strength Index (RSI), there may be a hint at bullish divergence but it is still too early to call. Bullish divergence shows higher lows on the RSI while price action exhibits lower lows often resulting in an upside reversal.
More By This Author:
Canadian Dollar Outlook: USD/CAD Gains On Oil Bloodbath, Fed Rate Verdict AheadDAX And FTSE Fragile As Market Sentiment Remains Cautious
Gold Price Forecast: XAU/USD Back Below $1700 On Fed Rate Hike Expectations


Comments
Log in or sign up to join the conversation.