AUD/USD Dribbles Back From Fed Rally Peak At 0.6580
Image Source: Unsplash
- AUD/USD tested into nine-day high after Fed knocked the Greenback lower.
- Soft Aussie GDP limits gains as markets await another Fed outing.
- US NFP Friday still looms over the horizon.
AUD/USD knocked into a two-week high near 0.6580 after Federal Reserve (Fed) Chairman Jerome Powell kicked the legs out from underneath the US Dollar (USD) on Wednesday. Fed Chair Powell noted that the Fed doesn’t see increased risk of an economic recession in the US this year while testifying before the US Congressional House Financial Services Committee. The head of the US central bank is expected to deliver further comments on Thursday when he appears for day two of the Fed’s Semi-Annual Monetary Policy Report.
Jerome Powell Speech: Fed Chair says they are not climate change policymakers
Australia’s latest Gross Domestic Product (GDP) print early Wednesday capped gains for the Aussie (AUD), coming in below market expectations to print at 0.2% for the fourth quarter compared to the previous quarter’s 0.3%, which was revised slightly higher from 0.2%. Australia’s Trade Balance for February lands early Thursday at 00:30 GMT, and is expected to print at 11.5 billion after the previous month’s 10.959 billion.
China’s Trade Balance (in USD terms) is also expected early Thursday at 03:00 GMT, and is expected to drive market sentiment in the Asia market session. China’s USD-denominated Trade Balance for February is forecast to jump to $103.7 billion versus January’s $75.34 billion on mixed trade results. Chinese Imports are expected to climb 1.5% versus the previous 0.2%, while Exports growth is expected to slow to 1.9% from the previous 2.3%.
Friday’s US Nonfarm Payrolls (NFP) will wrap up the trading week, and markets are expecting the key jobs data to print at 200K for February compared to January’s 11-month high of 353K.
AUD/USD technical outlook
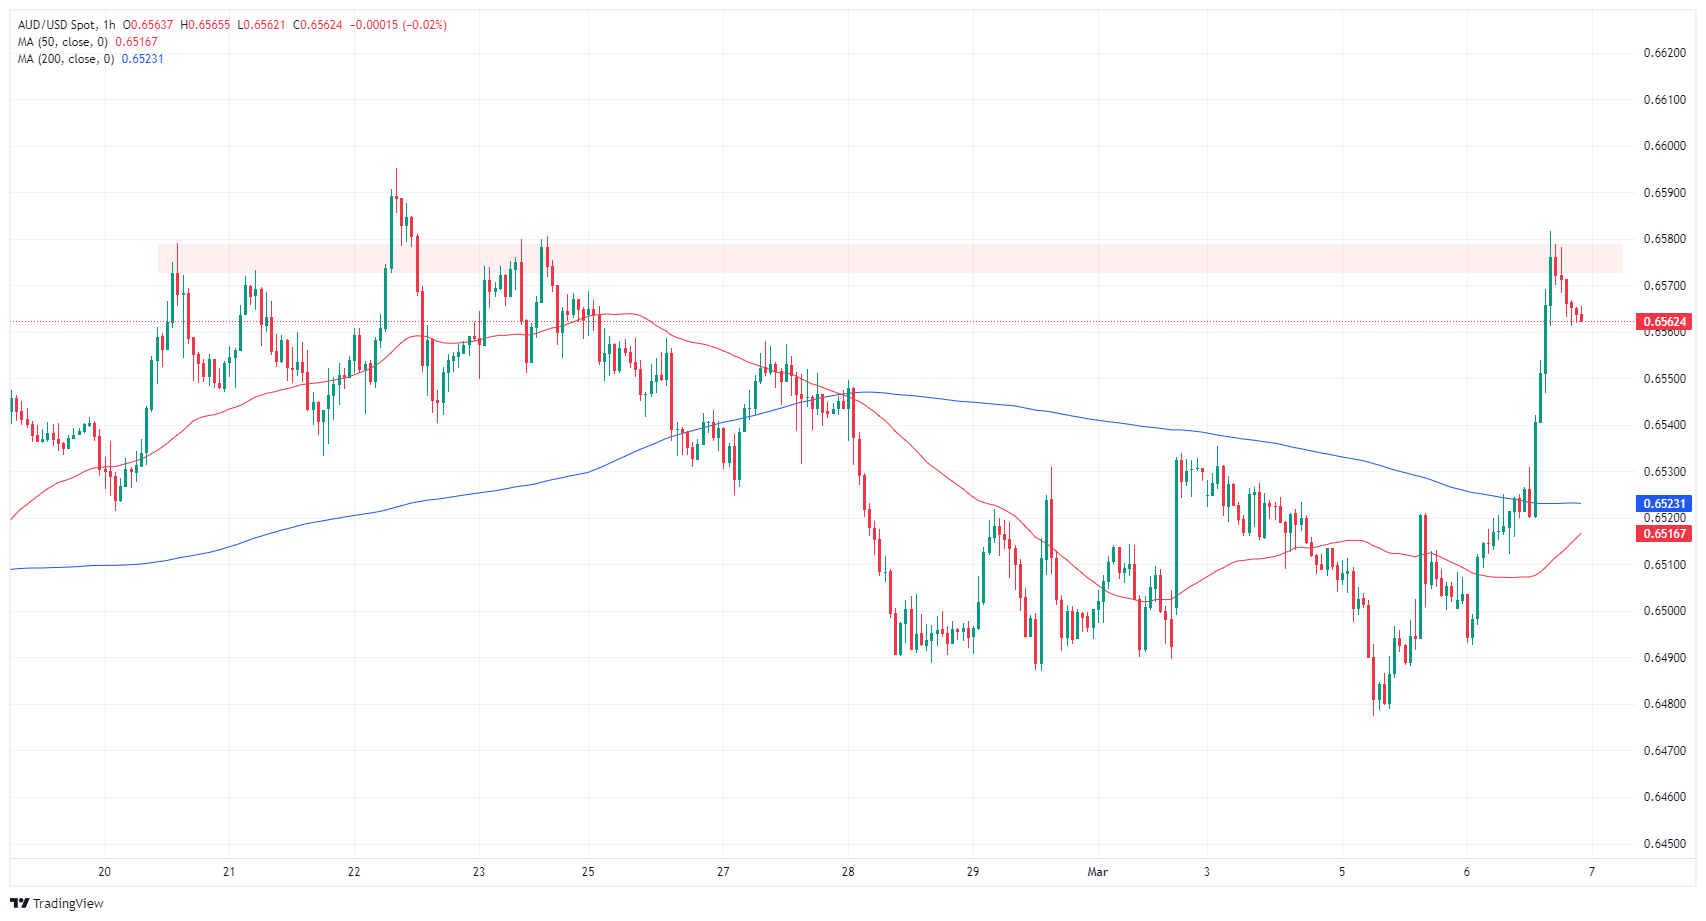
The AUD/USD climbed into a familiar technical resistance zone near 0.6580 before facing a rejection, dragging the pair back into 0.6560 and keeping the Aussie hung up in a thin chart region in the near-term.
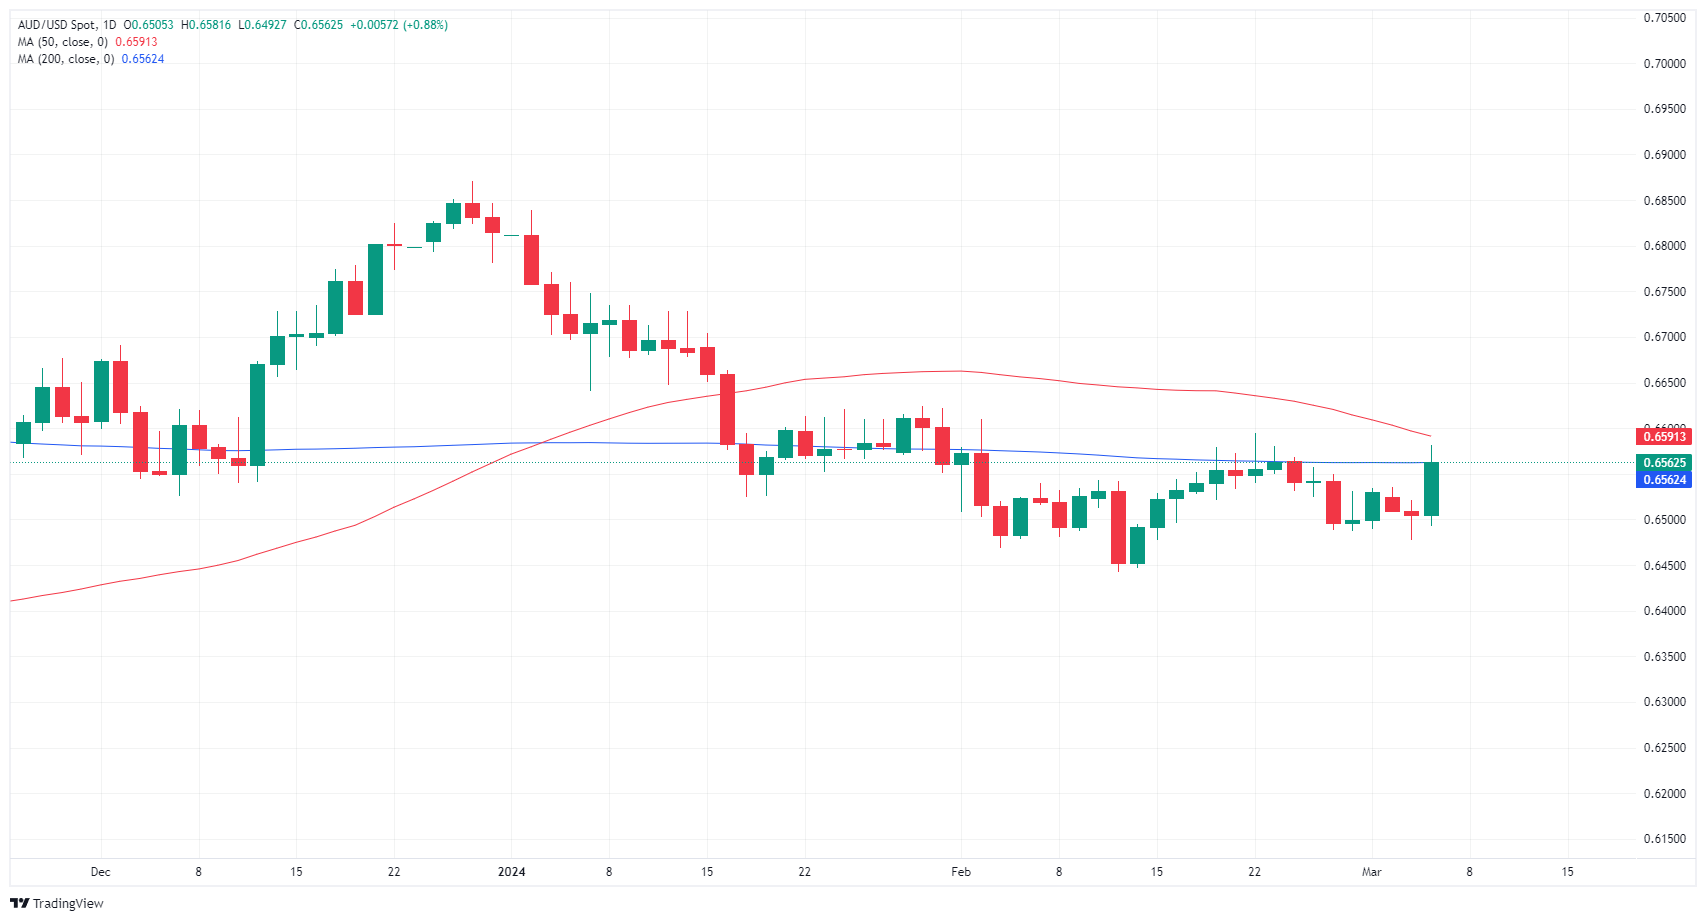
Wednesday’s bullish candle represents one of the pair’s strongest performances since December, but the pair has run into a technical ceiling at the 200-day Simple Moving Average (SMA) near 0.6560, and bullish momentum is set to falter back into the 0.6500 handle is sellers return to the fold.
AUD/USD hourly chart

AUD/USD daily chart

AUD/USD
| OVERVIEW | |
|---|---|
| Today last price | 0.6562 |
| Today Daily Change | 0.0057 |
| Today Daily Change % | 0.88 |
| Today daily open | 0.6505 |
| TRENDS | |
|---|---|
| Daily SMA20 | 0.6523 |
| Daily SMA50 | 0.6597 |
| Daily SMA100 | 0.6564 |
| Daily SMA200 | 0.6562 |
| LEVELS | |
|---|---|
| Previous Daily High | 0.6521 |
| Previous Daily Low | 0.6478 |
| Previous Weekly High | 0.6569 |
| Previous Weekly Low | 0.6487 |
| Previous Monthly High | 0.661 |
| Previous Monthly Low | 0.6443 |
| Daily Fibonacci 38.2% | 0.6494 |
| Daily Fibonacci 61.8% | 0.6504 |
| Daily Pivot Point S1 | 0.6482 |
| Daily Pivot Point S2 | 0.6458 |
| Daily Pivot Point S3 | 0.6438 |
| Daily Pivot Point R1 | 0.6525 |
| Daily Pivot Point R2 | 0.6545 |
| Daily Pivot Point R3 | 0.6569 |
More By This Author:
Silver Price Analysis: XAG/USD Flirts With YTD Peak, Bulls Await Move Beyond $24.00 MarkAUD/JPY Price Analysis: Bullish Sentiment Persists, Indicators Point To Weak Momentum
EUR/GBP Stands Flat After European Inflation Figures From February
Disclosure: Information on this article contains forward-looking statements that involve risks and uncertainties. Markets and instruments profiled on this page are for informational purposes ...
more


