

Image Source: Unsplash
The AUD/USD tapped a four-month high of 0.6728 in early Thursday trading, with the Aussie (AUD) extending a Fed-fueled risk rally after Australian labor figures beat the street, and the US Dollar (USD) tumbles across the broader FX market.
The US Federal Reserve (Fed) pivoted on its monetary policy outlook on Wednesday, tabling interest rate cut discussions for the first time in years. Fed policymakers currently expect 75 basis points in interest rate cuts through the end of 2024.
The US Dollar promptly deflated on Fed headlines, and the Aussie extended near-term gains after an unexpected bump in Australian Employment Change figures for November, adding 61.5K jobs versus the expected 11K. October previously added 42.7K new jobs (revised down steeply from 55K).
Purchasing Manager Index (PMI) figures will wrap up the trading week for both Australia and the US.
Australia’s Judo Bank Preliminary PMI figures for December will print early in the Friday trading session. The Australian economy has struggled of late, and Aussie bidders will be hoping for an improvement in the headline read. The Australian Judo Bank Manufacturing PMI last printed at 47.7 in November, with the Services PMI last printing a flat 46.0.
US PMI figures due later on Friday are expected to show a slight step back, with the S&P Global Manufacturing PMI seen declining from 49.4 to 94.3, and the Services PMI slipping back to 50.6 from 50.8.
AUD/USD Technical Outlook
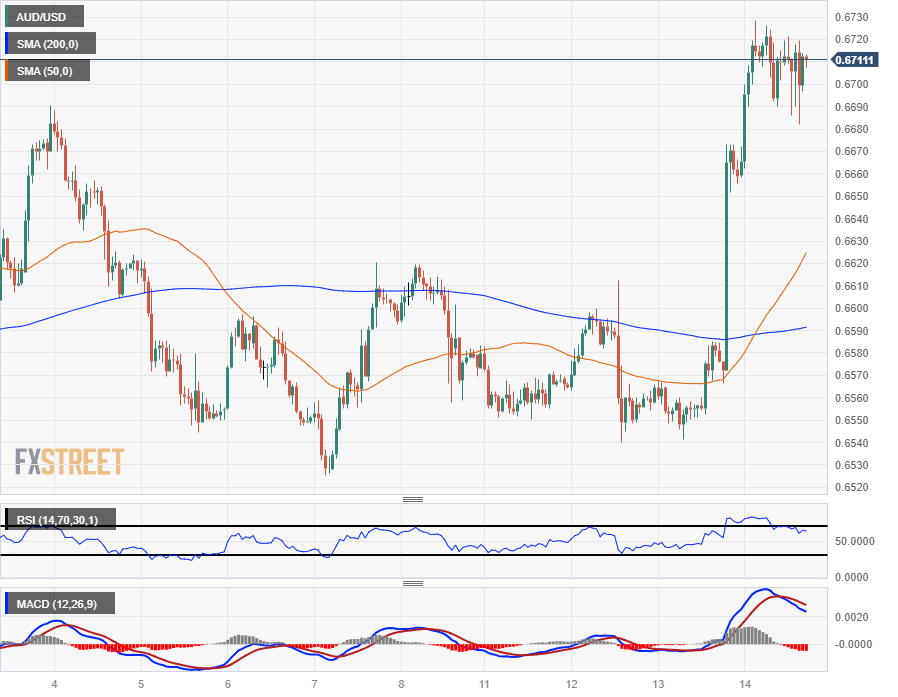
Despite Wednesday’s hard rally above the 0.6700 handle, the Aussie is running the risk of getting hung up in a near-term congestion zone as the AUD struggles to develop an extension in bullish momentum following the broader market’s US Dollar rebalance.
0.6720 is hardening into a near-term ceiling for intraday candles, and the struggle for Aussie bulls will be to mount a fresh attack and muscle the AUD/USD over the 0.6730 level to take a fresh run at the 0.6800 handle.
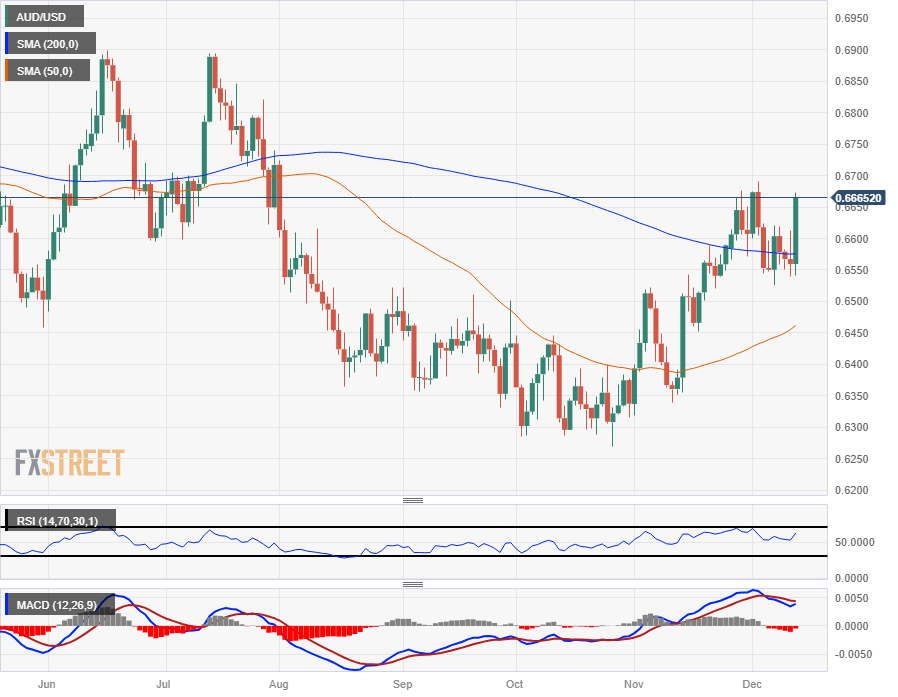
Daily candlesticks have the AUD/USD extending further into chart territory above the 200-day Simple Moving Average (SMA), and December’s early swing highs into 0.6670 could flip into technical support in the near-term.
AUD/USD Hourly Chart
(Click on image to enlarge)
AUD/USD Daily Chart
(Click on image to enlarge)
AUD/USD Technical Levels
AUD/USD
| OVERVIEW | |
|---|---|
| Today last price | 0.6712 |
| Today Daily Change | 0.0042 |
| Today Daily Change % | 0.63 |
| Today daily open | 0.667 |
| TRENDS | |
|---|---|
| Daily SMA20 | 0.6582 |
| Daily SMA50 | 0.6462 |
| Daily SMA100 | 0.6461 |
| Daily SMA200 | 0.6576 |
| LEVELS | |
|---|---|
| Previous Daily High | 0.6673 |
| Previous Daily Low | 0.6542 |
| Previous Weekly High | 0.6691 |
| Previous Weekly Low | 0.6526 |
| Previous Monthly High | 0.6677 |
| Previous Monthly Low | 0.6318 |
| Daily Fibonacci 38.2% | 0.6623 |
| Daily Fibonacci 61.8% | 0.6592 |
| Daily Pivot Point S1 | 0.6584 |
| Daily Pivot Point S2 | 0.6497 |
| Daily Pivot Point S3 | 0.6452 |
| Daily Pivot Point R1 | 0.6715 |
| Daily Pivot Point R2 | 0.676 |
| Daily Pivot Point R3 | 0.6847 |
More By This Author:
USD/JPY Grinds Into The Middle Just Above 145.00 Ahead Of The Year’s Final Fed Rate Call
Forex Today: Eyes On Last Fed Policy Announcements Of 2023
USD/CAD Drifts To New Lows Below 1.3600 Awaiting Fed’s Decision


Comments
Log in or sign up to join the conversation.