
Are We Near The End Of A Correction Or Near The Start Of A Bear?
Everybody in the market is asking themselves this question. I don't know the answer, but I know what the overwhelming weight of the technical evidence says at this point. The major averages have broken down below their 200 day moving averages and seem to have taken up residence there. That's bad. Trump is bullheaded about tariffs. That's bad. Powell is bullheaded about the cost of money. That's bad.
But when you look much beyond these facts, you see a much brighter picture. For instance, the selloff is based on the economy staging a major slowdown. If you look at the price of Dr, Copper (he has a Ph.D. in economics) you see nothing but a pathetic breakdown suggesting a recession soon. But this is based largely on the flap with Trump and China. We have the worst case scenario that both Trump and Powell can possibly present to the market. Trump is slapping tariffs on everything with China refusing to even talk, and Powell is continuing on his present course of over-aggressive tightening.
The only change that can be reasonably expected is China and Trump getting together, and Powell lightening up. Either one or both of these developments would end the selloff with a bang. I think it's silly that market is perplexed by a 3% cost of money (10 yr) in a good economy when historically we have 6%-8% in a boom. 1995 saw near 8%, and that certainly wasn't an economy killer or a market killer. The market may loose its fright over interest rates. It seems to me it's just sticker shock from too many years of no interest rates at all.
Another thing that strongly indicates the economy isn't going to get killed is the Baltic Dry Index. This tracks the cost of shipping dry bulk commodities. What is that? Think ore and all manner of components that are not wet, like oil, and are in the most raw form and take awhile to be made into product for sale. It must look ahead farther, and discounts economic facts and reacts sooner than the stock markets better than just about anything, If you look at its chart, you see that it has a strong habit of making major moves about 2 to 6 months in advance of the other market's big moves. (click on images to view)
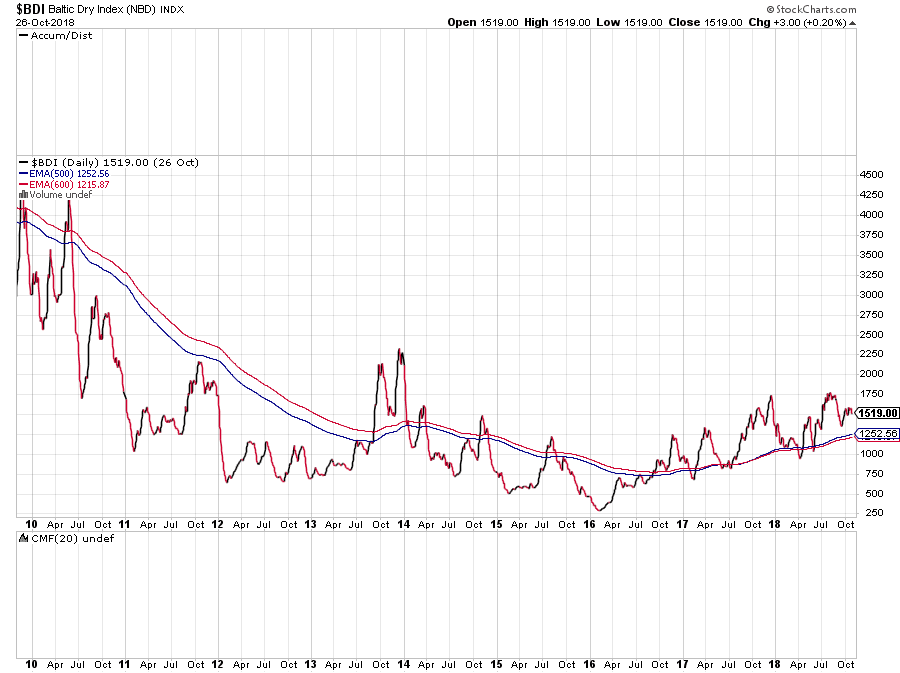
For example, look at 2014, when oil and the CRB commodity index tanked like crazy mid-year. The CRB is heavily weighted in oil, which has nothing to do with the dry index, but it also includes a multitude of economically sensitive materials. If you look at the chart, you see that it tanked fully six months ahead of the CRB, at the very beginning of the year. Also, the big dip in mid-2012 in the CRB and the stock market was foreshadowed six months earlier in the dry index. The stock market's swoon into the January 2016 disaster was preceded by the dry index swoon starting in early August 2015.
Which brings us to the present, where we see the February-April, 2018 stock swoon happening in the dry index starting in December last year. But look at what it's doing now. It foreshadowed our October swoon beginning in August, and now is resuming a fairly sharp uptrend out of the February drop! This suggests the same will happen soon with stocks.
I have used the 600/500 day moving averages on this high beta item to define big trends, and this pair clearly shows a downtrend until late 2016, then a big change and moving average crossover in mid-2017. Here the moving average pair changed from resistance to support level, which we are clearly obeying. The effects of a stagnant economy until 2017 seem to be morphing into a much better economy.
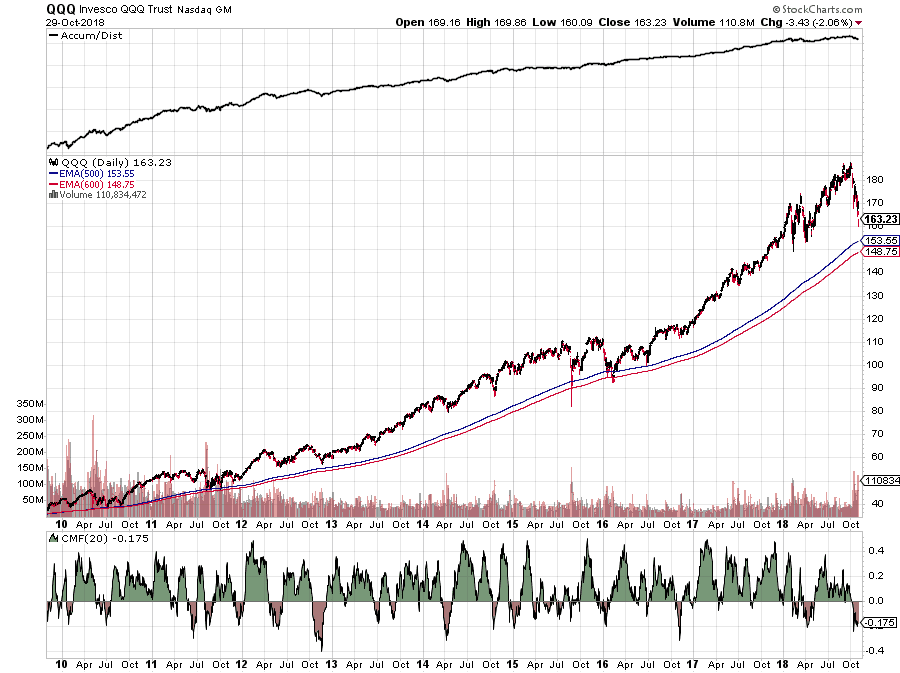
Another key leader index has been the QQQ, and we are holding past support there, too.
Taking this bigger view of the 600/500 moving average pair to the stock market:
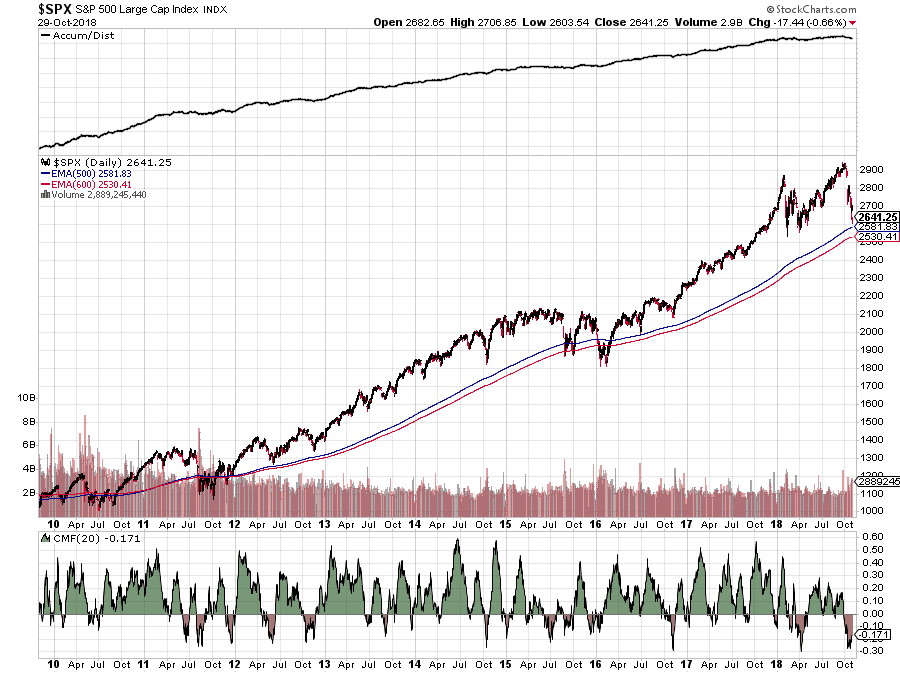
We see that the stock market is holding this support as it has several times in this bull. And another key leader index is the retail sector.
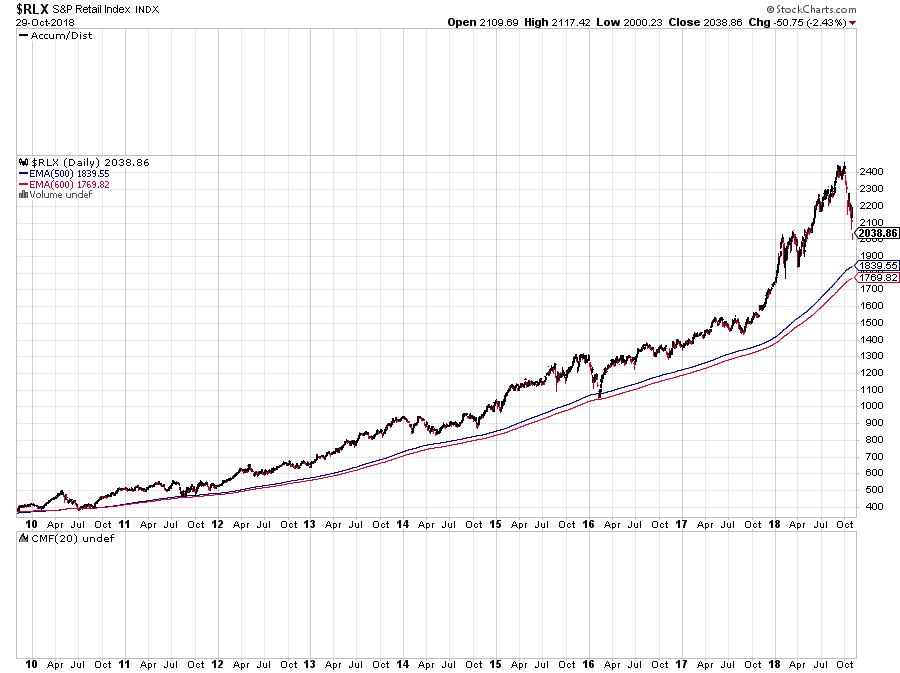
This is what is supposed to be in a bear from the tariffs. It doesn't look too bearish. It looks like it could stand some more abuse, and still be in a raging bull market.
Who knows what the markets will do, but the preponderance of the evidence, not from CNBC and market sentiment, but from the technicals of the bull leaders is suggesting that we are nearer the end than the beginning of a bull market correction, with much more bull to come. Some more compelling chart evidence for this is presented by Chris Ciovacco in his latest look.


