Another 8 Million Barrels Added To Oil Storage

EIA Inventory Report
The EIA Petroleum Report came out today and the report was pretty bearish. Much worse than the API Report released the night before. Of course, Oil was up on the report, in fact had a robust day at the close as the shorts got squeezed. This is nothing new for the market, almost every Wednesday or EIA Report day ends in the green, especially the Bearish ones, this goes back a long way in oil trading folklore. So much so that a funny joke amongst oil traders is “Crude Oil finished up $2 on the day, must have been a bearish inventory report!”

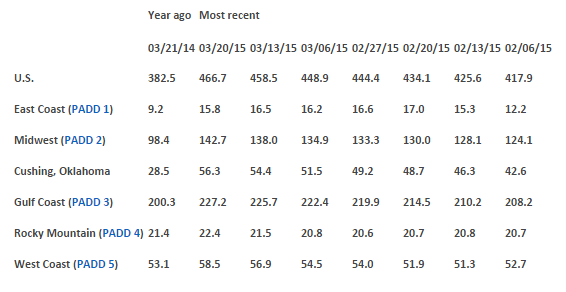
Almost all the 8 million build is centered on the Midwest to Cushing to the Gulf Coast refinery corridor route which is even more bearish as all 3 storage outlets are building together. There is so much oversupply in the market that they cannot even make one energy hub appear better by moving the oil from one storage hub to the next a la the massive pipeline initiatives from Cushing to the Gulf Coast Region. Just look at the year ago numbers, the already bloated Gulf Coast Region added another 27 million barrels to storage from this time last year. Cushing has added almost 28 million barrels to storage in a year, and the Midwest has added an astounding 44 million barrels to storage in a year. Moreover, we are still in the middle of the building season, as I have seen years where we build right through May and a couple weeks in June putting in higher and higher overall oil inventories. This year better be a short building season, or the rails are going to come off the oil market rather quickly over the next couple of months.
US Oil Production
In regards to the production side of the equation we had another higher high in the Production Trend:

We produced 9.42 million barrels per day versus 9.41 the prior week and up 1.23 million barrels per day versus this time last year. No wonder we keep having these large upside inventory builds each week. This illustrates that the Rig Count Number is highly misleading, what matters is the Overall Well Count Number. Producers can bring additional wells online to the existing Rigs in operation while cutting less efficient Rigs from the equation, and the total wells producing oil can actually go up while the overall rig count numbers are coming down. The result lends itself to higher production output numbers each week.
Oil Imports

Oil imports used to come down on a one to one basis as the domestic production increased but this correlation has come off the past year as imports have discovered a floor and continue to stay around these levels. As 7.39 versus 7.61 million barrels a day for a week isn`t going to offset the increased US Production gains year over year. Part of this is that certain refineries are set up in this country for Brent Oil, and they aren`t changing anytime soon because of the costs involved. So the baseline Brent comes to the US, the US Production keeps growing, and although the US exports refined product to reduce some of the North American Production, there just isn`t that level of demand to alter the supply demand imbalance in the market. There is just too much supply and not enough outlets via domestic demand, dwindling storage space, or export possibilities via products that changes this oversupply market dynamic.

Numbers, Assumptions & Capacity Constraints
The US has added almost 85 million barrels to storage facilities since January of 2015; that is an average of 7.67 million barrels of oil added to storage every week for the last 11 weeks, and it shows no sign of letting up anytime soon. So those who believe that there is plenty of storage available in the US need to start running the numbers. For example, on 09/26/2014 there was 356 million barrels in storage and now there is 466 million barrels as of 03/20/2015; that is an addition of 110 million barrels added to storage in roughly 6 months’ time. Furthermore, the trend of growing inventory builds is going the wrong direction for those thinking storage capacity isn`t an issue in the marketplace. What I mean by that is the builds are getting consistently bigger on average with each passing month. This last 8 weeks of inventory builds has really been unprecedented in the oil market, the run of consecutive large builds is unchartered territory for modern oil markets. Therefore all those storage capacity experts out there; what assumption are you building your model upon? Is it the last 12 months, 9 months, 6 months or 3 months from an inputs standpoint? If inventory builds stop this month that is one thing, but the ironic part of low oil prices means producers are finding more and more creative ways to pump more product to make up for lost revenue.

Unchartered Territory when everyone needs more Cash to Pay Existing Obligations
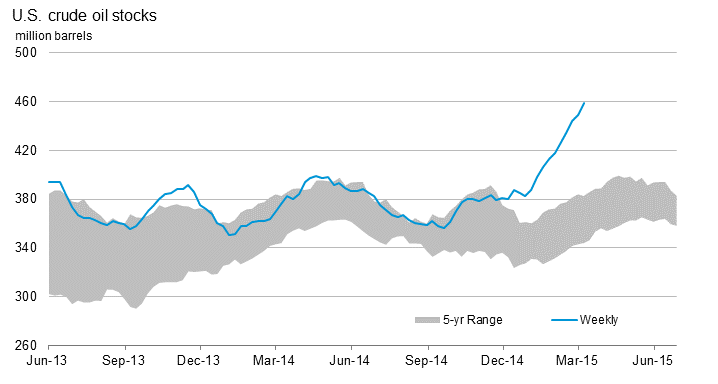
In short they need the cash to pay bills, who is to say that we don`t have inventory builds until the oil market finally crashes and production is forced offline? We really don`t know how this will all play out as this is unchartered territory in the modern era of oil markets. Even when prices were high oil inventories were well above their five year averages, so we are already at a poor structural starting point for a bear market in oil and the storage capacity issues that go along with this environment. I would say that if we have inventory builds from this point forward just based upon looking at the prior year`s additions in oil builds we have the following guideposts: In 2014 we continued to add to inventories through May 09, 2014, we added to oil inventories through May 24th for 2013, and builds continued through June 22nd for 2012. At this pace of builds things should get interesting in regards to storage capacity, and the economic decisions revolving around this logistical constraint. And if low prices throw a new dynamic in the market as yet un-factored into many pre-existing models in this modern era of high oil prices, the builds could possibly be much bigger on average compared with the previous three years from this point forward, and they may continue for much longer than usual.

500 Million Barrels Outside of SPR in Storage?
Another alternative scenario is that they just flat line through the drawing season, setting the stage for a fall collapse in oil prices if US production doesn`t come in substantially for the next inventory building season starting the latter part of this year. My point is it all depends on what the input numbers end up being, and nobody with a high degree of certainty has a good handle on these input assumptions, as we really are in unchartered territory. What if we have 10 more weeks of 8 million barrel inventory builds; that is 80 million barrels right there added to constrained existing storage facilities. This high an assumption I believe is problematic for both storage capacity and oil prices, and can it absolutely be ruled out? Who knows when everyone is incentivized to increase production as much as possible to make up for lower revenue streams to pay debt obligations and stay in business? We are already seeing secondary share issuances, the need for cash throws an ironic twist into the oil oversupply equation. What if we have builds straight through the summer driving season?

Economic Demand: Domestic & Global Perspective
Throw in the fact that US GDP and economic manufacturing data has been weak the first quarter of 2015; things seems to have slowed once again from an economic standpoint here in the US. In looking at the global perspective China`s latest weak PMI economic numbers indicate that their economy is really at its lowest growth phase in over a decade, and throw in the fact that they are done adding oil to their inventory reserves stocking program and the global demand picture for oil looks less than robust as well.

Still Oversupplied Oil Markets
In conclusion the demand picture looks weak both from a domestic and global perspective, the supply side of the equation is still a problem, and we haven`t even touched on Iran chomping at the bit to export more oil with some kind of a Nuclear Program Deal easing existing sanctions. The world had too much oil sloshing around 5 years ago, it had even more 9 months ago when prices started to decline, and it has even more today with $50 oil. Maybe the oil market needs to crash like the 1980s for the supply/demand imbalance to be rightsized in the market. Who knows where oil prices are ultimately headed and for how long, but one thing that does appear certain, is the supply demand picture hasn`t gotten any better since Saudi Arabia first signaled to markets that there was a problem. There is still far too much oil supply in the market right now with nowhere to go!

Electronic ‘Paper’ Energy Markets & Central Banks Distorted Fundamentals from Prices

The electronic artificial oil market where nobody took delivery for the physical commodity for the last decade with derivative style fiat stimulating markets juiced up by QE and ZIRP from central banks, throw in meaningless Arab Spring & Middle East Geo-Political Premiums to boot, and it is little wonder everybody and their uncle was suddenly in the oil producing business. The problem is that since the financial crisis, and the end of the commodity bull cycle after China`s Hosting of the Olympics was in the rear view mirror, the price of oil has been highly disconnected with the fundamentals of the global economy. And I am afraid that until electronic markets become physical delivery markets, prices will still outpace the fundamentals of the oil market, and the supply imbalance will take longer to right size with actual demand. This is where storage constraints eventually will balance out the supply demand equation, and bring about some discipline on behalf of producers. Storage constraints will eventually force a market crash in oil prices, until the oil market crashes completely like the 1980s, there are still too many oil producers currently in the market. Forget about Rig Counts, we need to see Producer Counts go down considerably, until that happens the oil market hasn`t bottomed.
All of the content on EconMatters is provided without assurance or warranty of any kind. The opinions expressed here are personal views only, and no warranty of fitness for any particular use, ...
more


The summer of 2008 was Lovely for me, because I was in Paris and in love...with drinking wine outdoors. The price of oil was going into orbit, and predictions were that it would go over 200 dollars. Then of course it started down, and it kept going down until it reached 32 dollars. That was when OPEC gave a demonstration of just what they could do. They had a couple of meetings and the oil price started up again, and did not stop until the price was over 100. We dont hear much about OPEC these Days, but I suspect that they can live with what is taking Place a while longer. At least the countries in the Middle East can.
An absolutely important article where I and my work is concerned, however remembering what happened in 2008-09, I wonder how OPEC is going to fit into the present Picture. Maybe I'll try to figure it out if the weather here doesn't get better.
What specific aspect of 2008-09 are you referring to?
Well, considering the US uses 18.5 million barrels per day, this tells me we don't have enough.