
An Old-School Indicator That Bears Watching – Even Today
I recently wrote a position paper entitled The Tactical Dilemma which explored the trials and tribulations that tactical managers have faced since 2011. In the report, I detailed the fact that many tried and true technical indicators, which had performed very well for tactical managers for a very long time, had effectively stopped working as the QE-era progressed and “the machines” began to take over trading on a daily basis.
However, a Bloomberg article this morning reminded me that there is still one area of technical analysis that should not be ignored: Supply and Demand.
The Bloomberg article highlighted a report from JP Morgan, which showed that the supply of global equities actually shrank in 2016 – something that had never happened since they began following the data in 1999.
The message was clear. Demand for equities continues to grow around the world as capital markets become more accessible to an ever increasing group of savers/investors. And with the supply of equities shrinking, well, my Econ 101 course taught me that prices tend to increase in this scenario.
As part of my own work, I look at the demand/supply situation in the markets on a daily and weekly basis. However, instead of focusing on the actually supply of equities available, I focus on the relationship of “demand volume” and “supply volume.”
The concept of demand and supply volume was created by the folks at Ned Davis Research and is a takeoff on the age-old up-volume vs. down-volume idea. NDR then tracks a cumulative sum of the two indicators and plots them on a graph.
In working with this indicator series for many years now, it has become clear to me that when demand-volume is above supply-volume, the bulls tend to control the ball – and vice versa. And this approach did a fine job of alerting us to when the recent cyclical bear started and ended. On the chart below, the black line represents demand-volume and the red line is supply volume.
Demand-Volume vs. Supply Volume
(Click on image to enlarge)
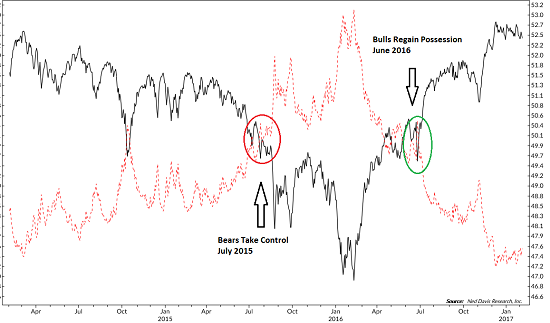
To be sure, this is a longer-term, big picture indicator and is NOT intended to provide “signals” when to enter and/or exit the market. No, I see this type of chart as a “confirmation” indicator – again, from a big-picture standpoint. And as the chart of the S&P 500 below illustrates, the indicator did a fine job of “warning” that all was not right with the world in July 2015.
S&P 500 – Weekly
(Click on image to enlarge)
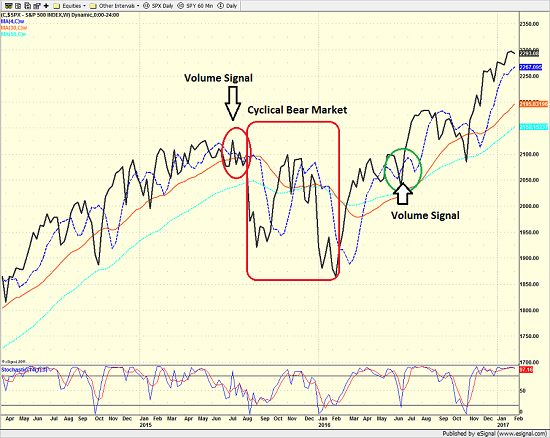
The good news is that this longer-term indicator suggests that the bulls remain large and in charge at the present time as the demand-volume line remains WELL above supply-volume line. It is also worth noting that the trend of demand-volume is still in great shape.
Compare and contrast the current situation on the demand/supply chart to the action seen from 2014 into 2015, where the demand-volume line was clearly trending in the wrong direction – for an extended period of time.
Yes, one can argue that the uptrend of demand-volume has stalled in recent months. And if the black line on the chart were to make a “lower low” I think it would be something to take note of. So, I will continue to watch this situation carefully in the coming weeks/months.
But, as I wrote yesterday, for now, the bulls remain in possession of the ball. And hopefully the relationship of demand-volume to supply-volume will again alert us when this is no longer the case.
Current Market Drivers
We strive to identify the driving forces behind the market action on a daily basis. The thinking is that if we can both identify and understand why stocks are doing what they are doing on a short-term basis; we are not likely to be surprised/blind-sided by a big move. Listed below are what we believe to be the driving forces of the current market (Listed in order of importance).
1. The State of Trump Administration Policies
2. The State of the U.S. Economy
3. The State of Global Central Bank Policies
Thought For The Day:
You can’t get much done in life if you only work on the days when you feel good. -Jerry West
Disclosure: At the time of publication, Mr. Moenning and/or Sowell Management Services held long positions in the following securities mentioned: none. Note that positions may change at any ...
more


thanks for sharing