

Image Source: Pexels
An article I published a little over a month ago covered whether or not the economy was in a recession or not and highlighted some of the difficulty in assessing much of the economic data today. An equity market recovery seemed to be unfolding after the June low before selling off in August. Another recovery appeared to be unfolding in the Labor Day shortened holiday week, with the S&P 500 Index up 3.61% in that four-day period.
Then on the next Monday (Sept. 12) of this past week, the S&P 500 Index added another 1.06% return. This positive momentum hit a wall on Tuesday with the U.S. report on August inflation and the release of consumer price index data. The report noted August inflation declined from an annual rate of 8.5% to 8.3%, yet the S&P 500 fell 3.59% on Tuesday.
A few important components in the report saw inflation increase. Core CPI, which excludes food and energy, rose from July's year-over-year reading of 5.9% to a year-over-year rate of 6.3% in August. Additionally, some services components saw inflation rates accelerate from the prior month.
Energy has a large influence on overall inflation, and inflation continues to decline in this category. Lower energy inflation is certainly a positive; however, this is a category where assessing the sustainability of lower prices is cloudy. The continuing Russia/Ukraine conflict is one reason, but the Biden administration's continued release of oil from the Strategic Petroleum Reserve is another.
As the chart below shows, the reduction of oil in the SPR has been significant, and oil inventory in the SPR is now at a level last seen in 1984. These releases most likely contributed to recent lower energy prices.
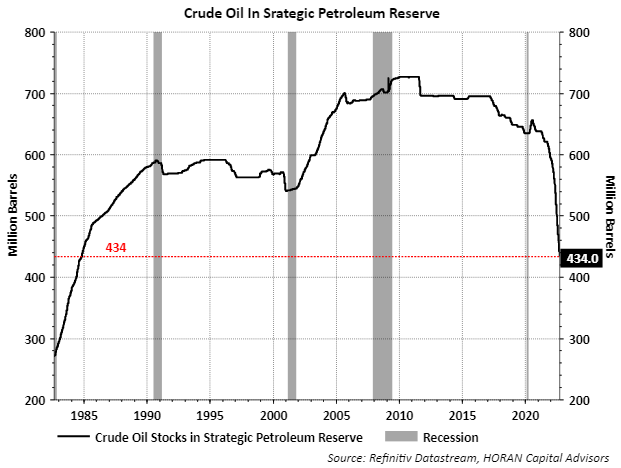
Indications from the Biden administration suggest that they plan to refill the SPR in the near future, which would place a floor on oil prices, at a minimum, and potentially see energy prices trend higher.
FedEx (FDX) reported dismal earnings on Friday, sending the stock down 21%. The company cited weaker demand in Asia and Europe as a large part of the weakness.
Some view FedEx as a bellwether for the global economy given its interconnectedness in worldwide economic activity with its package delivery business. Are FedEx results an indication of broader weakness in global economic activity? Some are saying FedEx issues are company-specific, though. A recent article in Forbes notes:
"The company needs (and has needed) fixing, and now it is having to deal with rising costs (inflation), expanding competition (like the U.S. Postal Service improvements and Amazon's (AMZN) delivery services), and a capital market that is getting more discriminating regarding risk and weak sales/earnings. (And that means those overly distant '2025 financial targets' carry little weight. In fact, they imply a management casualness that raises risk even higher.)"
Also, the Forbes article highlights that FedEx indicates they will cut capital spending next year while at the same time maintain the existing $1.5 billion stock buyback program. On the one hand, it may make sense to buy back stock when the company's stock price is depressed. However, FedEx might benefit more if those funds were instead used to improve its operations.
Another sign of potential economic weakness is seen in August imports coming through the largest U.S. port located in Los Angeles. The L.A. port saw its largest decline since May 2020 as inbound containers fell 17%. The import weakness is also showing up in broader global shipping data.
The Baltic Dry Index (BDI) essentially measures global freight rates for dry bulk shippers. When global demand for shipping rises, the BDI rises as well. The BDI peaked in October of last year and has mostly been trending lower since, an indication of less demand for shipping, as shown in the chart below.
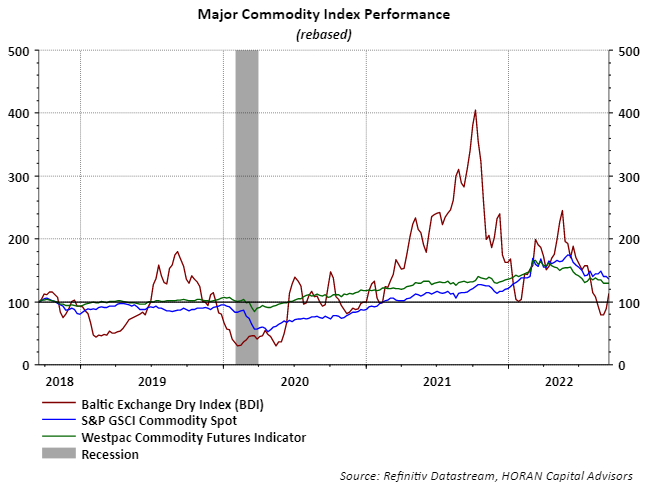
Also displayed on the chart is the S&P GSCI Commodity Spot Index. The commodity index began to turn lower in June and is indicating that demand is easing.
Scott Grannis, former economist at Western Asset Management, recently wrote an article highlighting why inflation may have peaked already. Scott makes the case that inflation has likely peaked, and he thinks the Fed might not be as hawkish as the collective wisdom of the market believes. If the Fed slows its rate hiking expectations, the article indicates this could lead to a positive economic and market outcome.
In conclusion, a large part of the economic data seems to be indicating the economy is slowing. This is not a surprise, as the first and second quarter GDP readings were negative, indicating negative economic growth. Compounding the evaluation of the data is the supply chain disruption coming out of the pandemic.
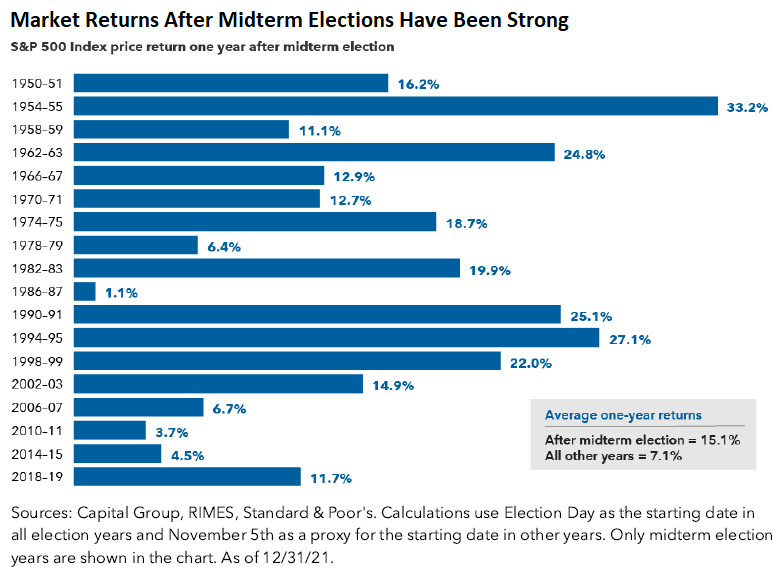
If inflation is under control as detailed in the Scott Grannis article, and the Fed is nearer to a pause than not, a favorable environment could unfold as the end of the year approaches. As noted in an earlier post, some of the strongest equity market returns follow midterm election years. With this being such a year, a rally after the midterm election could unfold, as shown below.
More By This Author:
Market Turns Lower On Fed CommentsRecession Or Not
Small Businesses In A Sour Mood

Comments
Log in or sign up to join the conversation.