
AG Mortgage Investments Upgraded To Strong Buy
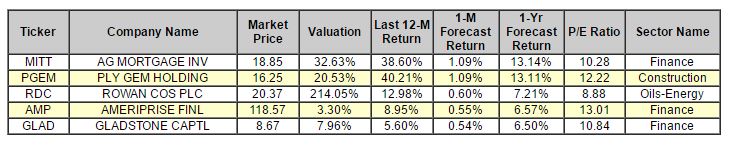
AG Mortgage Investment Trust (MITT) is our top-rated upgrade this week and it is a STRONG BUY--as is Ply Gem Holdings (PGEM). The rest of the components on our list are BUY-rated companies.
AG Mortgage Investment Trust, Inc. is a real estate investment trust. The Company invests in, acquires and manages residential mortgage assets, other real estate-related securities and financial assets. Its non-Agency RMBS investments include fixed- and floating-rate securities, including investment grade and non-investment grade. The Company's Agency RMBS investments include mortgage pass-through securities and collateralized mortgage obligations. The Company mainly invests in CMBS and asset-backed securities. AG Mortgage Investment Trust, Inc. is headquartered in New York, New York.
Below is today's data on AG Mortgage Investment Trust (MITT):
Recommendation: We updated our recommendation from BUY to STRONG BUY for AG Mortgage Investment Trust on 2016-12-09. Based on the information we have gathered and our resulting research, we feel that AG Mortgage Investment Trust has the probability to OUTPERFORM average market performance for the next year. The company exhibits ATTRACTIVE P/E Ratio and Book Market Ratio.
You can download a free copy of detailed report on AG Mortgage Investment Trust (MITT) from the link below.
|
ValuEngine Forecast |
||
|
Target |
Expected |
|
|---|---|---|
|
1-Month |
19.06 | 1.09% |
|
3-Month |
19.59 | 3.94% |
|
6-Month |
20.21 | 7.21% |
|
1-Year |
21.33 | 13.14% |
|
2-Year |
23.42 | 24.22% |
|
3-Year |
24.75 | 31.29% |
|
Valuation & Rankings |
|||
|
Valuation |
32.63% overvalued |
Valuation Rank |
|
|
1-M Forecast Return |
1.09% |
1-M Forecast Return Rank |
|
|
12-M Return |
38.60% |
Momentum Rank |
|
|
Sharpe Ratio |
-0.02 |
Sharpe Ratio Rank |
|
|
5-Y Avg Annual Return |
-0.41% |
5-Y Avg Annual Rtn Rank |
|
|
Volatility |
22.01% |
Volatility Rank |
|
|
Expected EPS Growth |
0.18% |
EPS Growth Rank |
|
|
Market Cap (billions) |
0.54 |
Size Rank |
|
|
Trailing P/E Ratio |
10.28 |
Trailing P/E Rank |
|
|
Forward P/E Ratio |
10.26 |
Forward P/E Ratio Rank |
|
|
PEG Ratio |
56.55 |
PEG Ratio Rank |
|
|
Price/Sales |
4.26 |
Price/Sales Rank |
|
|
Market/Book |
0.79 |
Market/Book Rank |
|
|
Beta |
0.87 |
Beta Rank |
|
|
Alpha |
0.13 |
Alpha Rank |
|
Market Overview
|
Summary of VE Stock Universe |
|
|
Stocks Undervalued |
31.77% |
|
Stocks Overvalued |
68.23% |
|
Stocks Undervalued by 20% |
14.61% |
|
Stocks Overvalued by 20% |
37.17% |
Sector Overview
|
Sector |
Change |
MTD |
YTD |
Valuation |
Last 12-MReturn |
P/E Ratio |
|
Industrial Products |
-0.00% |
3.66% |
28.87% |
26.10% overvalued |
23.56% |
24.79 |
|
Multi-Sector Conglomerates |
0.28% |
4.33% |
15.61% |
23.52% overvalued |
13.22% |
19.61 |
|
Oils-Energy |
0.27% |
3.84% |
32.16% |
20.73% overvalued |
22.65% |
25.49 |
|
Aerospace |
-0.19% |
1.06% |
14.05% |
19.40% overvalued |
13.14% |
20.26 |
|
Finance |
0.27% |
3.84% |
18.50% |
18.47% overvalued |
13.75% |
18.31 |
|
Basic Materials |
-0.67% |
3.70% |
58.52% |
17.98% overvalued |
66.40% |
27.50 |
|
Construction |
-0.22% |
4.06% |
40.18% |
17.61% overvalued |
24.51% |
20.89 |
|
Transportation |
-0.09% |
3.95% |
21.65% |
17.48% overvalued |
8.57% |
19.09 |
|
Business Services |
0.86% |
3.49% |
25.94% |
14.52% overvalued |
6.37% |
24.43 |
|
Computer and Technology |
-0.22% |
2.04% |
22.53% |
13.77% overvalued |
11.74% |
30.12 |
|
Retail-Wholesale |
0.00% |
3.26% |
5.68% |
12.44% overvalued |
7.64% |
24.20 |
|
Auto-Tires-Trucks |
0.25% |
4.30% |
15.30% |
11.63% overvalued |
20.07% |
15.17 |
|
Consumer Discretionary |
0.62% |
3.37% |
13.64% |
10.97% overvalued |
12.41% |
24.25 |
|
Utilities |
0.23% |
3.04% |
16.37% |
10.10% overvalued |
18.54% |
22.46 |
|
Consumer Staples |
0.89% |
2.86% |
10.50% |
6.84% overvalued |
6.70% |
24.13 |
|
Medical |
0.66% |
1.33% |
-0.15% |
2.82% undervalued |
-7.07% |
27.86 |
Disclaimer: ValuEngine.com is an independent research ...
more

