
When it comes to analyzing stock market bottoms, MACD and RSI indicators are two popular tools used by traders and investors. In this article, we’ll take a closer look at how these indicators have predicted stock market bottoms in the past, specifically with regards to the stock forecast for Advanced Micro Devices (AMD).

MACDs and RSI: The Basics:
Before we dive into the specifics of how these indicators have predicted AMD stock forecast, it’s important to understand how MACDs and RSI work. MACD, or Moving Average Convergence Divergence, is a momentum indicator that measures the relationship between two moving averages. RSI, or Relative Strength Index, measures the speed and change of price movements.
The Role of Sentiment:
As we’ve discussed in previous articles, sentiment plays a crucial role in stock market bottoms. High levels of anxiety are usually associated with a stock market bottom, which is why it’s important to look at sentiment indicators alongside MACDs and RSI.
AMD Stock Forecast: What’s next
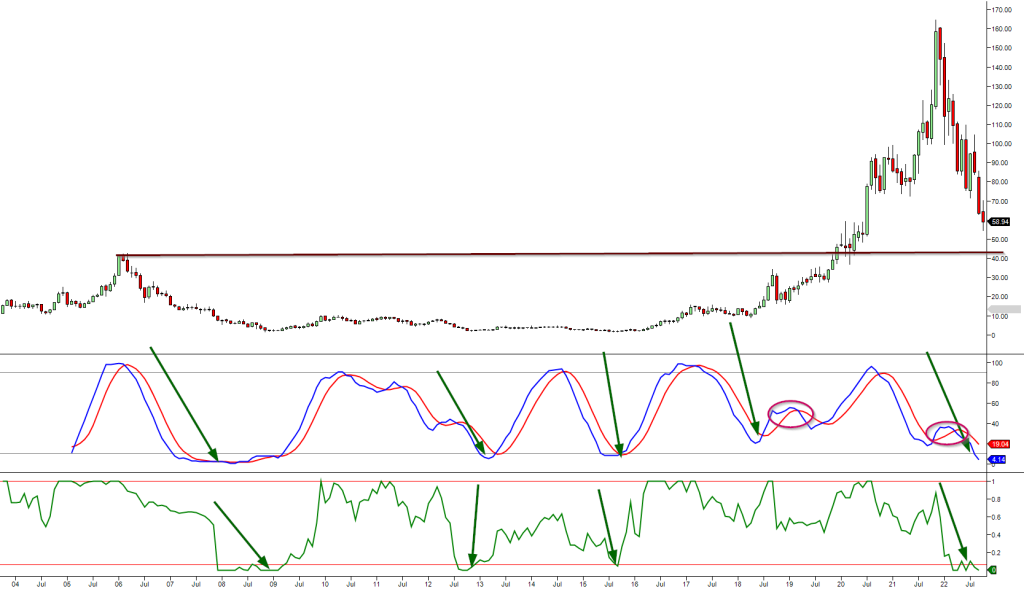
In every instance, after the MACDs and RSI bottomed, AMD tacked on several hundred percentage points in gains from its low. The gains were more pronounced when the RSI and MACDs traded in the extreme zones.
Case Studies:
Let’s examine the last three moves from the above chart. Values will be taken when the MACD’s bottomed and Topped.
Sept 2015 low of 1.65 Feb 2017 High 15.55
April 2018 Low 9.05. Now the MACDs topped (Sept 2018) in the oversold ranges, which is very bullish but let’s assume we use this topping as the end of another cycle. Sept 2018 High 34.14
However, if we start from April 2018 and continue until the MACDs traded in the overbought ranges, this is what we would get April 2018 Low: 9.05 August 2020 high: 94
AMD Stock Forecast: Gains and Cycles:
In the above three instances, the lowest gain AMD tacked on was 270%. In each case, AMD at least tacked on gains of 270% for the record; the 270% gains were an incomplete cycle. Complete MACD cycles almost generated gains of 10X.
The Fascinating Setup:
Now, look at the fascinating setup, which matches what took place from April 2018 to Sept 2018 (red circles) and Oct 2021 to Jan 2022. In both instances, the MACDs topped out in the oversold ranges, and the subsequent bullish crossover led to outsized gains. Whenever the MACDs top out prematurely, the next bullish crossover usually triggers an explosive move. One only has to grab 100% of this move via an option to hit a huge home run.
Conclusion:
When it comes to analyzing AMD stock, MACD and RSI indicators can provide valuable insights into potential stock market bottoms. By combining sentiment indicators with technical indicators, traders and investors can gain a better understanding of when to buy and sell.
More By This Author:
Stock Market Bottom: The Role Of SentimentBlood On The Streets: Exploring The Opportunity In Times Of Economic Turmoil
Dow Jones Outlook: Understanding The Dangers & Rewards Of Crisis Investing


Comments
Log in or sign up to join the conversation.