
ADRs Best And Worst Report - October 13, 2014
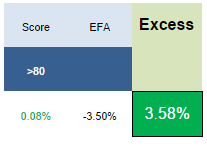
The best scoring ADRs from one year ago (10/14/2013) returned an average 0.08%, 3.58% better than the MSCI EAFE index (EFA). The best performing from our list one year ago have been SHPG up 112%, YPF up 43%, and TTM up 33%.
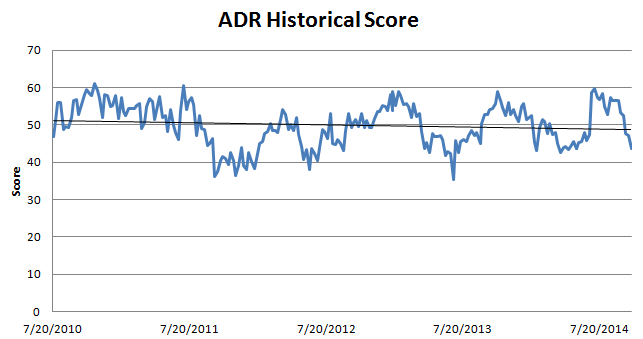
The average score across ADRs this week is 43.68, below the four week moving average score of 47.77. Scores are in the process of retreating to actionable levels in the low 40's -- see the following chart which shows post-recession score lows.
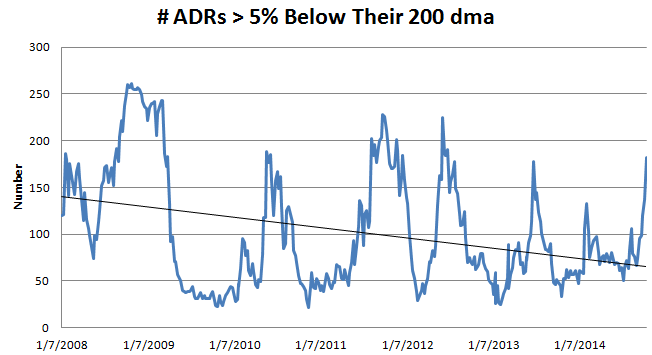
This next chart shows the number of ADRs that are trading more than 5% below their 200 day moving average. This chart is helpful for gauging pessimism and identifying potential capitulation. You'll notice we're not quite "there" yet, but getting close.
The average ADR is trading -24.78% below its 52 week high, -8.9% below its 200 dma, has 3.95 days to cover held short, and is expected to post EPS growth of 19.3% next year.
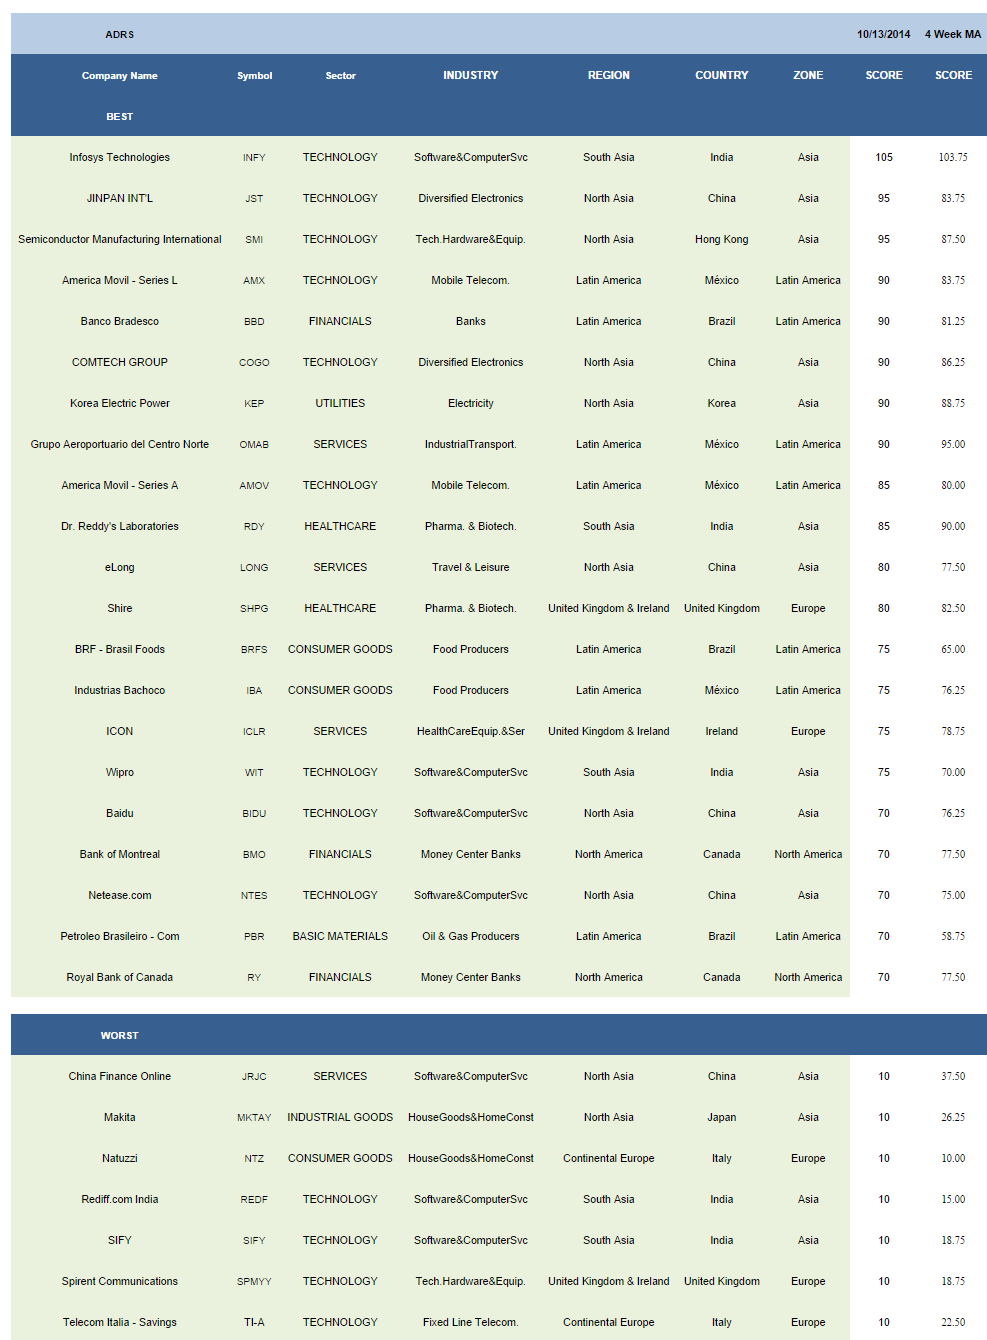
The best scoring sector across our ADR universe is services (OMAB, LONG, ICLR, WNS, SIG, RUK), followed by healthcare (RDY, NVS, NVO, SNY). Consumer goods, utilities, and basics score in line with the average universe score. Technology, financials, and industrial goods score below average.
12368.png)
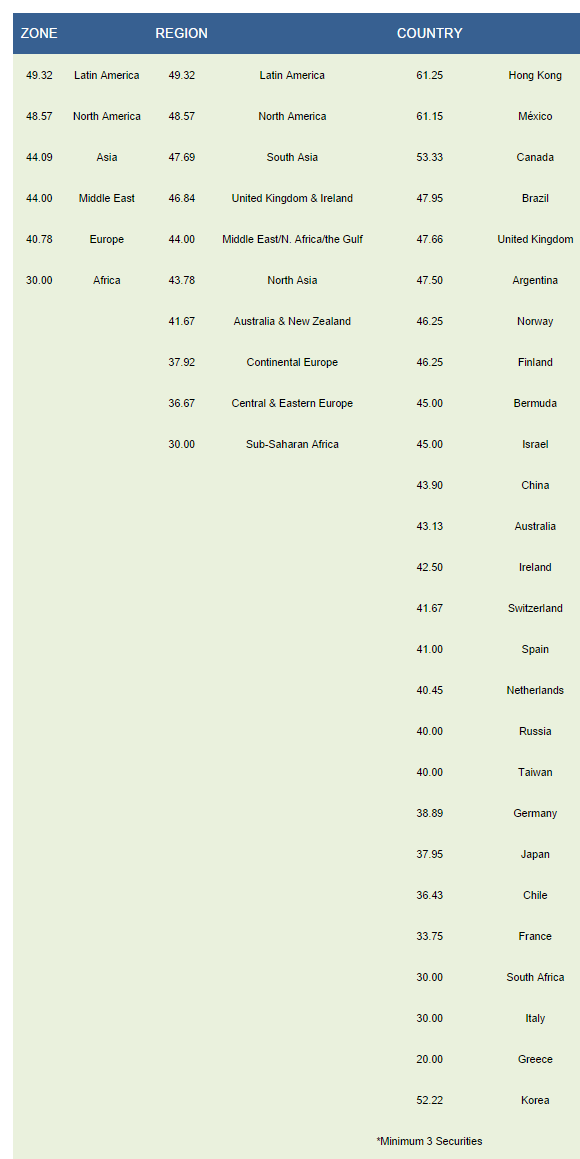
The best scoring zones are Latin America (AMX, OMAB, BBD, AMOV, IBA, BRFS, PBR) and North America (RY, BMO, BCE). The top scoring regions are Latin America, North America, and South Asia (INFY, RDY, WIT, WNS). Hong Kong (SMI, HKTV, MPEL), Mexico (AMX, OMAB, AMOV, IBA), Canada (RY, BMO, BCE), and Brazil (BBD, BRFS, PBR) are the best scoring countries.
Disclosure: None.


