
ADRs Best & Worst Report - March 9, 2015
TM editors' note: This article discusses a penny stock and/or microcap. Such stocks are easily manipulated; do your own careful due diligence.
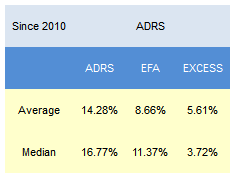
Since 2010, the average return of our weekly best scoring ADRs have outpaced the MSCI EAFE by a median 372 bps over the following year, with no turnover.
The average ADR score is 47.37, which is below our four week moving average score of 49.93. The average ADR is trading -24.33% below its 52 week high, -3.46% below its 200 dma, has 3.22 days to cover held short, and is expected to grow its EPS by 5.33% in the coming year.
Click on picture to enlarge
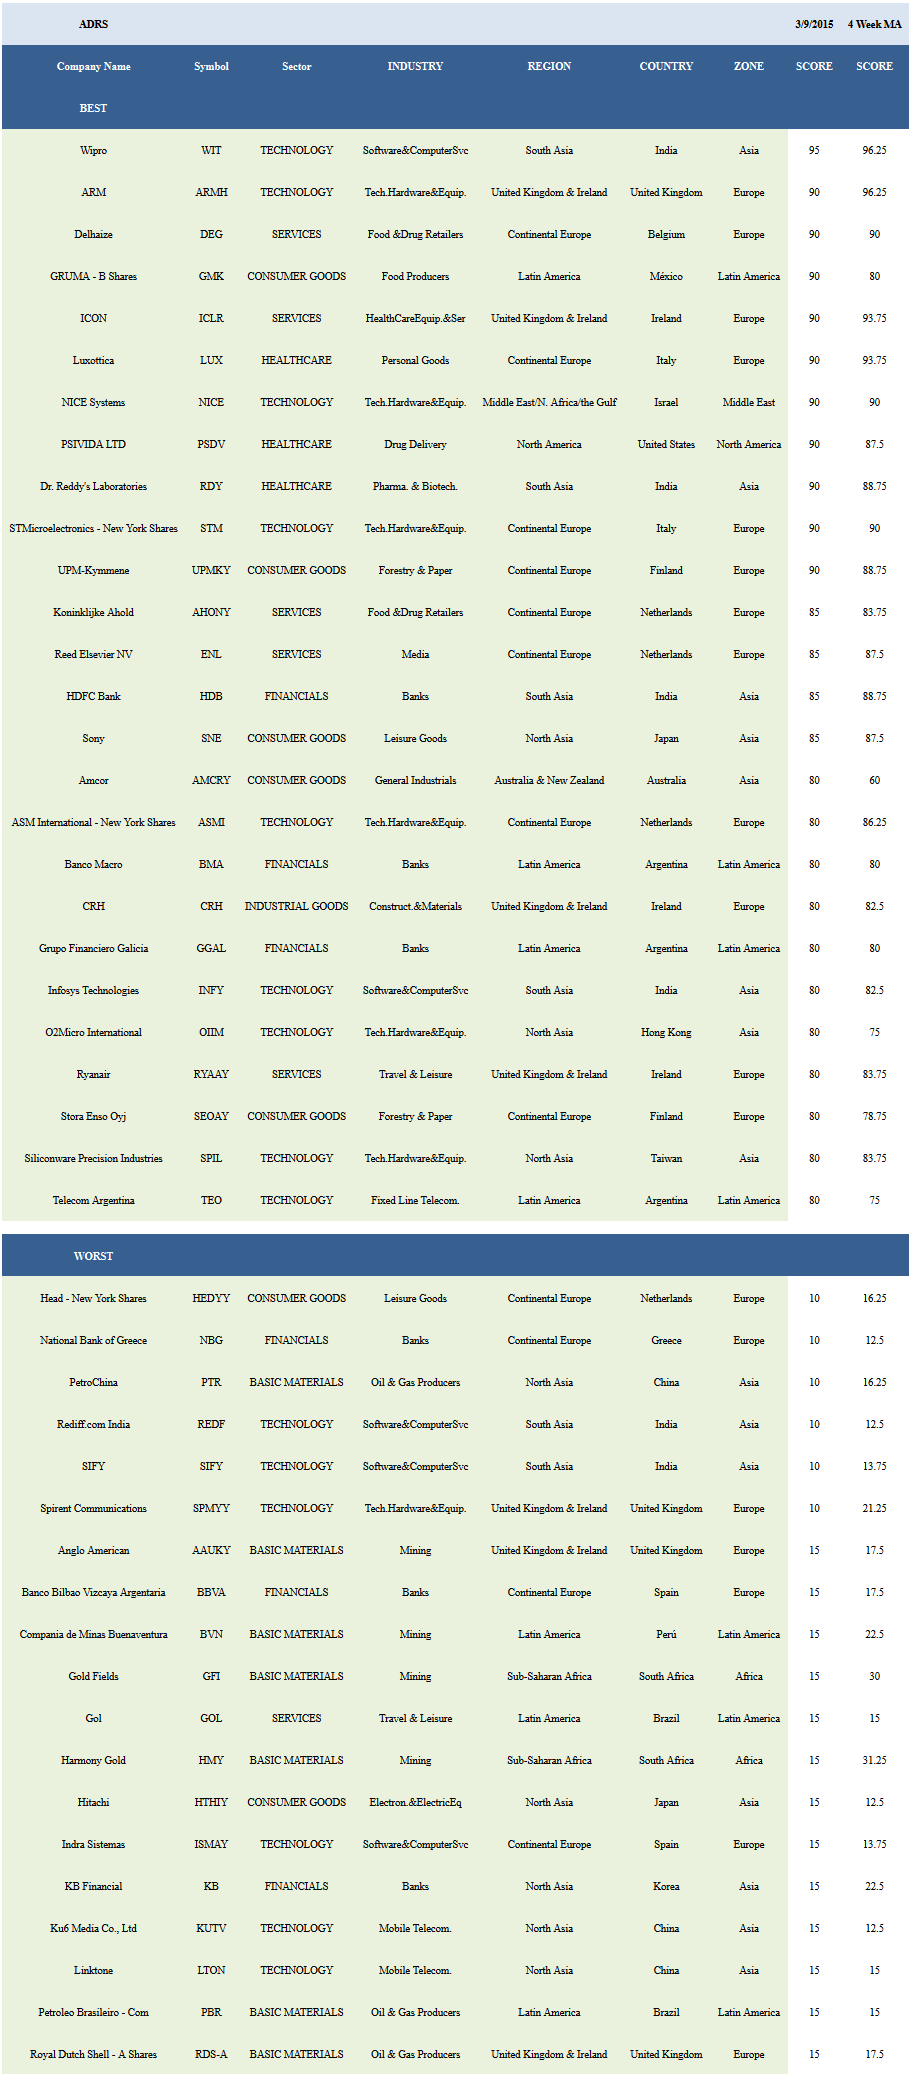
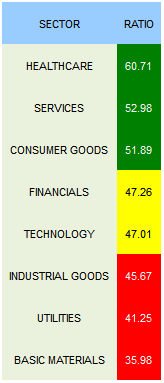
The best scoring sector across our ADR universe is healthcare (RDY, PSDV, LUX, FMS, FLML, EDAP). Services (ICLR, DEG, ENL, AHONY, RYAAY, FLY, ANW, OMAB) and consumer goods (UPMKY, GMK, SNE, SEOAY, AMCRY, TM, NSANY) also score above the universe average score. Financials and technology stocks score in line. Industrial goods, utilities, and basic materials stocks score below average.
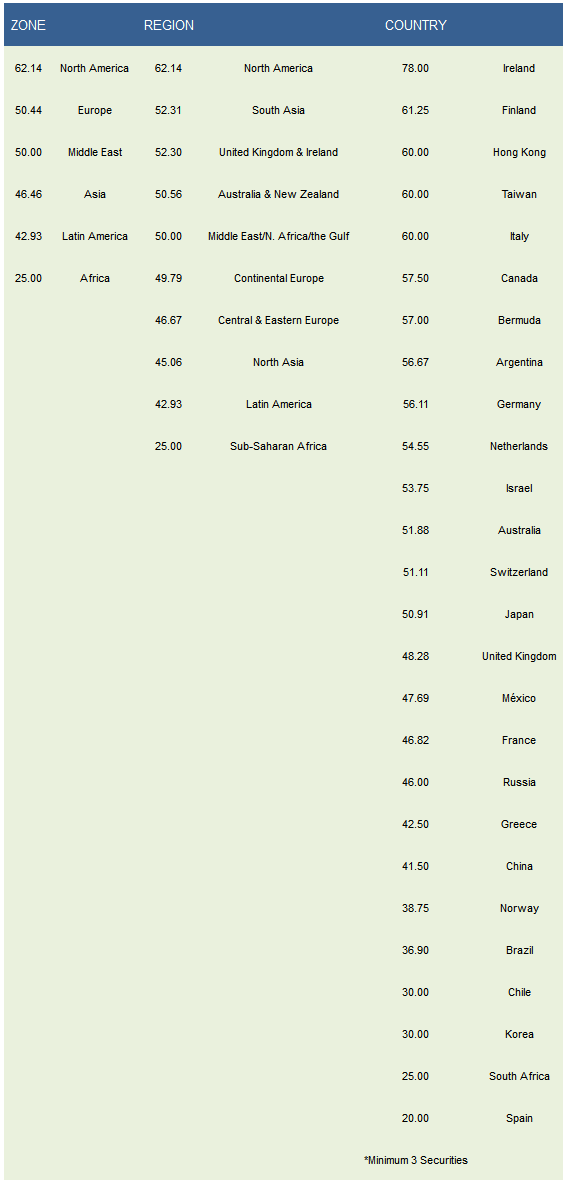
Across our ADR universe, the top zones are North America (PSDV, BCE, RY, BMO) and Europe (STM, ARMH, ICLR, DEG, LUX). The best regions are North America, South Asia (WIT, RDY, HDB, INFY, CYD), and the UK/Ireland (ARMH, ICLR, RYAAY, CRH, BT, FLY, PUK). The highest scoring countries are Ireland (ICLR, RYAAY, CRH), Finland (UPMKY, SEOAY), Hong Kong (OIIM, MPEL), Taiwan (SPIL, ASX, TSM), and Italy (STM, LUX).
Disclosure: None.


