
A Review Of Market & Macro Indicators
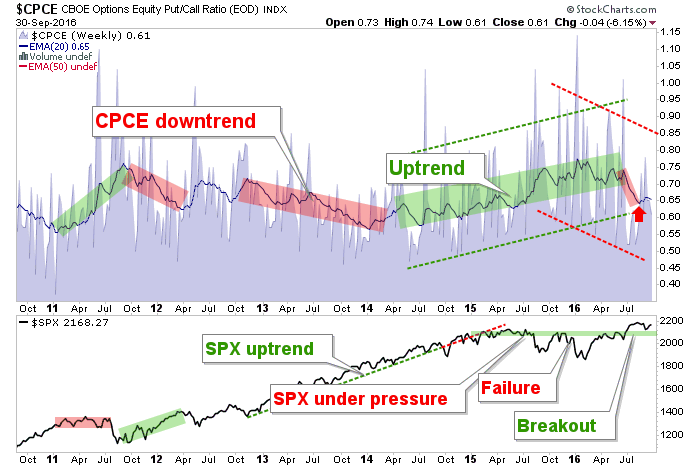
Equity Put/Call ratio continues in its 2016 downward trend. This has supported the bullish view ever since we identified the breakdown in the previous CPCE uptrend. The market is doing its part thus far, by holding key support.
VIX held support last week and in line with the idea that risk will be ever present if this market goes manic up, we can expect periodic flare ups like the 3 orange dots that have cropped up during 2016 alone.

Junk bonds have held the highs in nominal terms and also been firm for most of 2016 in ratio to higher quality bonds. This is and has been an ongoing signal that a manic bull phase can erupt. Again, I don’t make the charts; I just pull them up every weekend, shake my head just like you and then tell you what I think they mean.

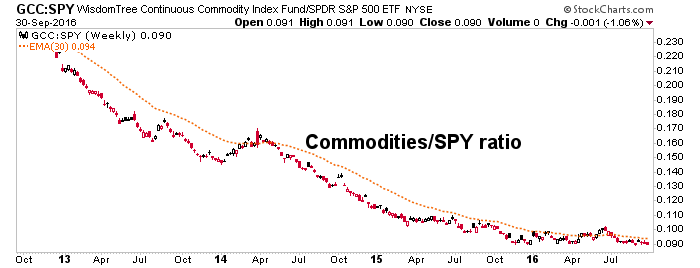
Commodities continue not to show a pulse vs. the US stock market.
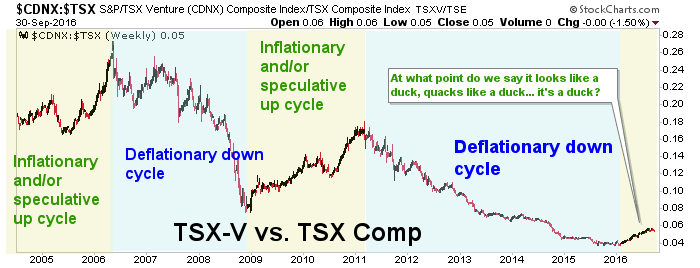
Yet the highly speculative TSX-V made a bullish signal, which is being tested now.
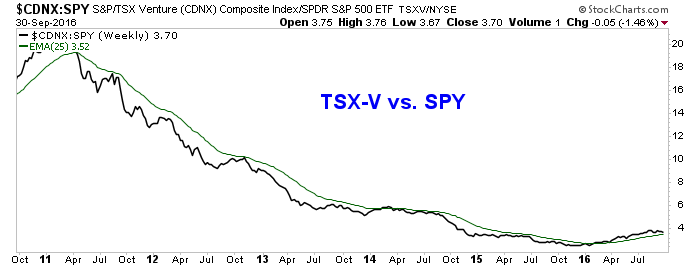
The same signal is easing a bit in Canada.
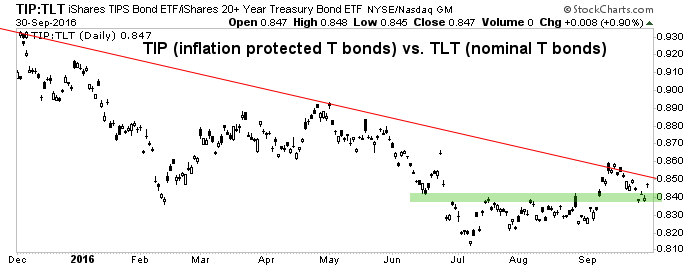
While the US inflation expectations barometer decides whether to hold support and break above the trend line or fail. Right now, it’s in process to one or the other.
Silver-SPX maintains a bullish stance, though in consolidation.

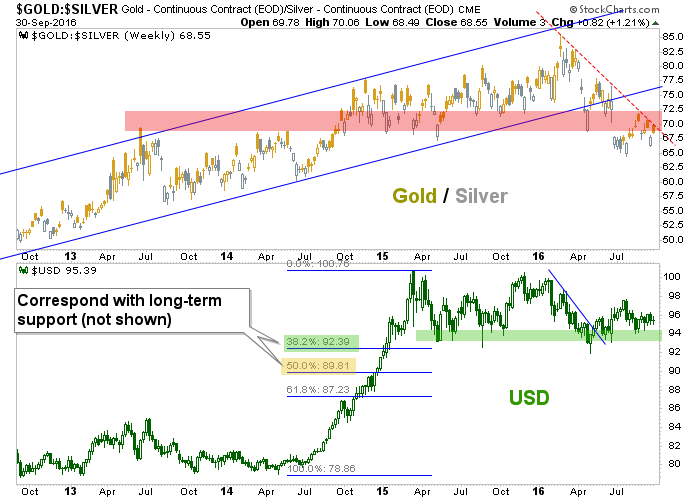
Silver-Gold ratio (SGR) and CRB should eventually correlate. SGR is on a bullish trend change signal until it no longer is. That is a bullish underpinning for commodities, the case for an inflation trade and most asset markets with the exception of Treasury bonds.

Nor would a rising SGR (declining Gold-Silver ratio) be a positive for USD.
BKX and Gold each continue to hold support. Both items would probably benefit in an inflation phase, if it results in rising rates and yield curves.

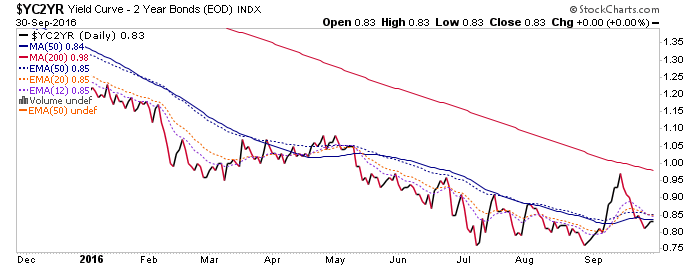
Said curve is not however, rising in any kind of trend.
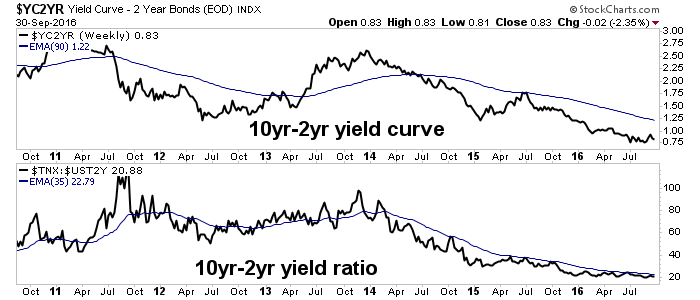
It bounced last month. Was that a start? To be determined.
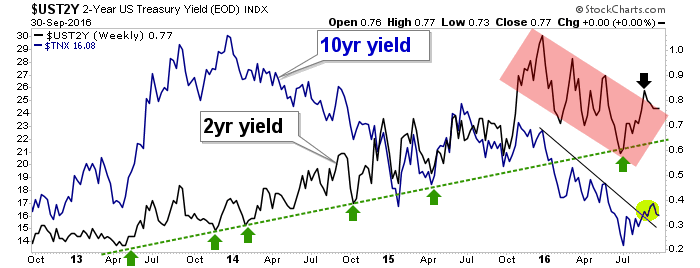
Here are the nominal 10’s and 2’s. The markets have mostly been on the deflation theme after FOMC packed its bags for its break until November. FOMC fretted again about inflation not being quite high enough and the market has hinted that it believes them. But the 10 year yield bears watching in its little 2016 trend line break.
LIBOR and TED are RISING!!!! We all gonna die!

I don’t want to make fun of things that should be indicating systemic stress. But I do want us not to panic and take the bait for every disaster in a continuum of Euro Crisis! → Fiscal Cliff! → Cyprus! → Greek Debt Meltdown! → Ukraine/Russia! → Bird Flu & Ebola! → NIRP! → Terror Attacks! → and drum roll please… BREXIT!!!!
The macro markets are high risk because they are being remotely managed, whether by Jawbone or action, by policy makers the world over who have abandoned any moorings to what we used to call sound theory and practice (in my opinion).
But we need to guard against the line of thinking that goes “wow, this is really screwed up, we are in deep trouble and this is gonna be really BEARISH!!!!“ That is not how markets tend to work, especially post-2011 with everything on hyper kinetic information overload. It is these very stresses that often help keep a bull mania climax in play.
Disclosure: Subscribe to more


Thank for sharing