
Current Position of the Market
- SPX Long-term trend: There is some evidence that we are still in the bull market which started in 2009 and which could continue into 2021 until major cycles take over, and it ends. A move up to ~4500 is possible before the current bull market makes a final top and SPX corrects into its next major cycle low due in 2023.
- SPX Intermediate trend: SPX correction underway.
- Analysis of the short-term trend is done daily with the help of hourly charts. They are important adjuncts to the analysis of daily and weekly charts which determine longer market trends.
- Cycles: Looking ahead!
- 7-yr cycle – Last lows: 2009-2016. Next low: ~2023
Market Analysis (Charts, courtesy of StockCharts)
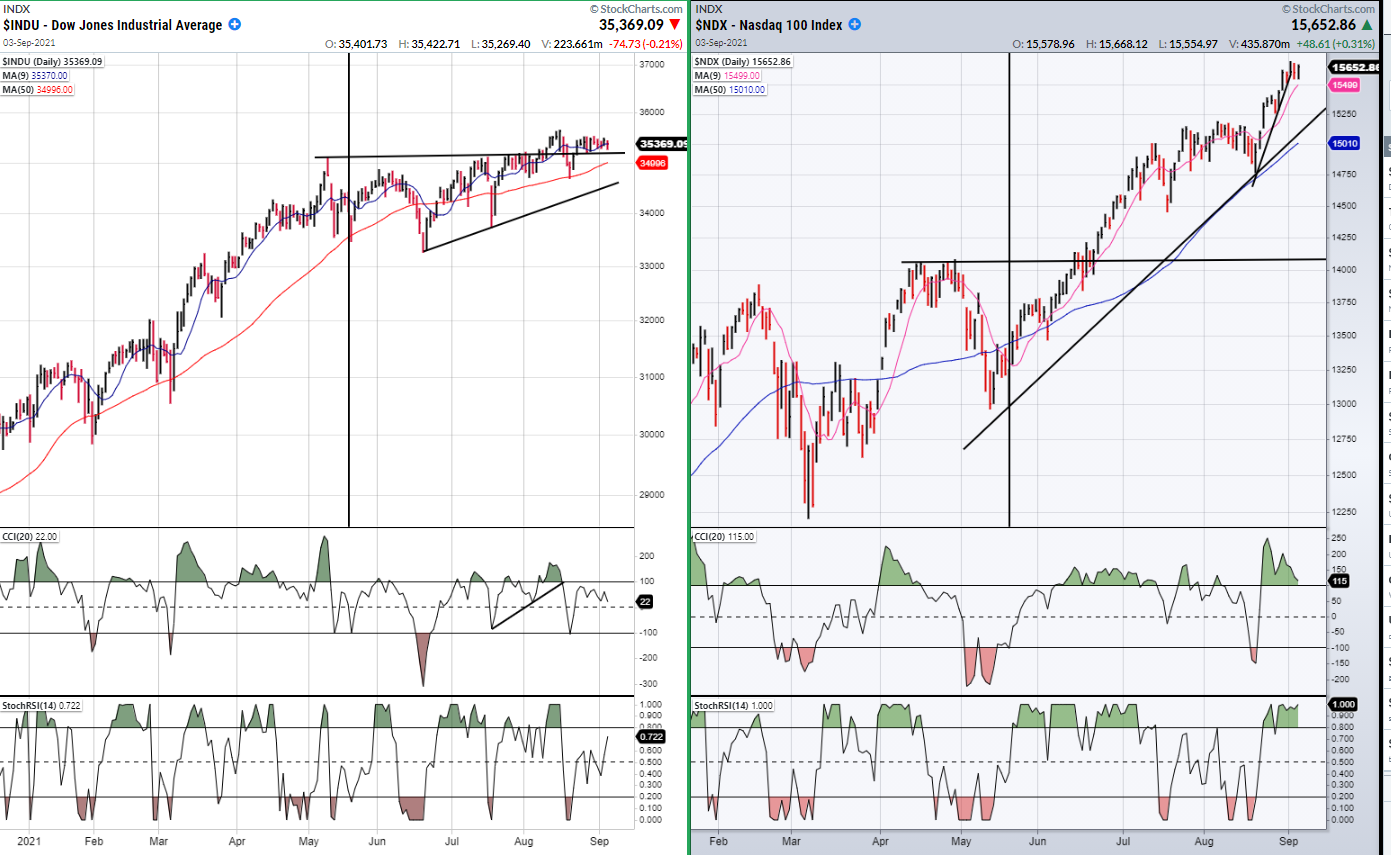
DJIA-NDX Daily
The two charts below make obvious the difficulty of analyzing the “market”—as a whole! Do you focus on the DJIA which has risen 4% since that vertical line was drawn on 5/18/21, or on the NDX which rose 17% during the same time period (a little over 4 months). And, if the Dow did not have MSFT and AAPL as its components, would it even have risen that much! The “POOR” S&P, which is caught in the middle as a hybrid of the two has to be seen as the most representative of the whole market, and this is why it has been, and continues to be the focus of our analysis.
(Click on image to enlarge)
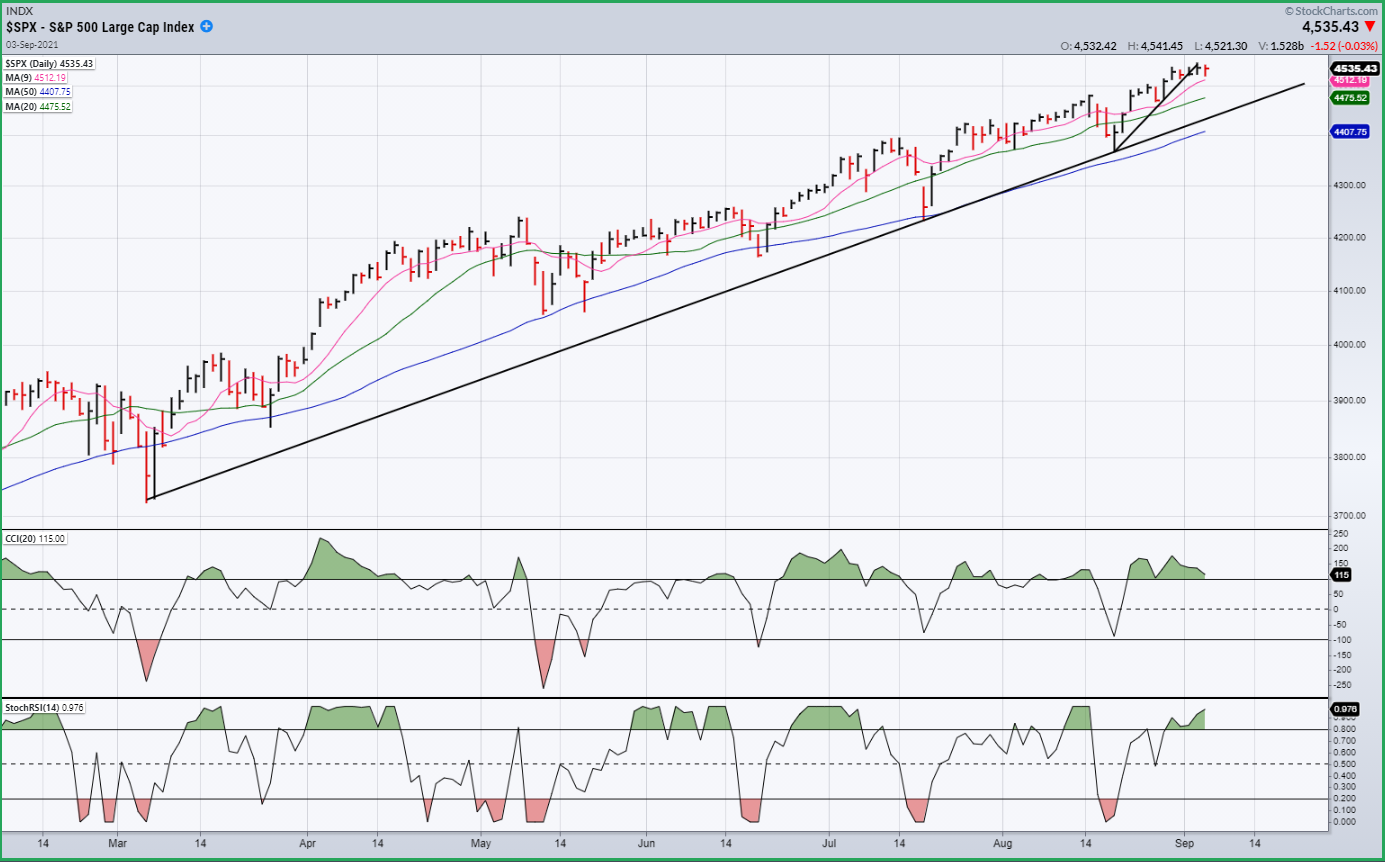
SPX daily chart
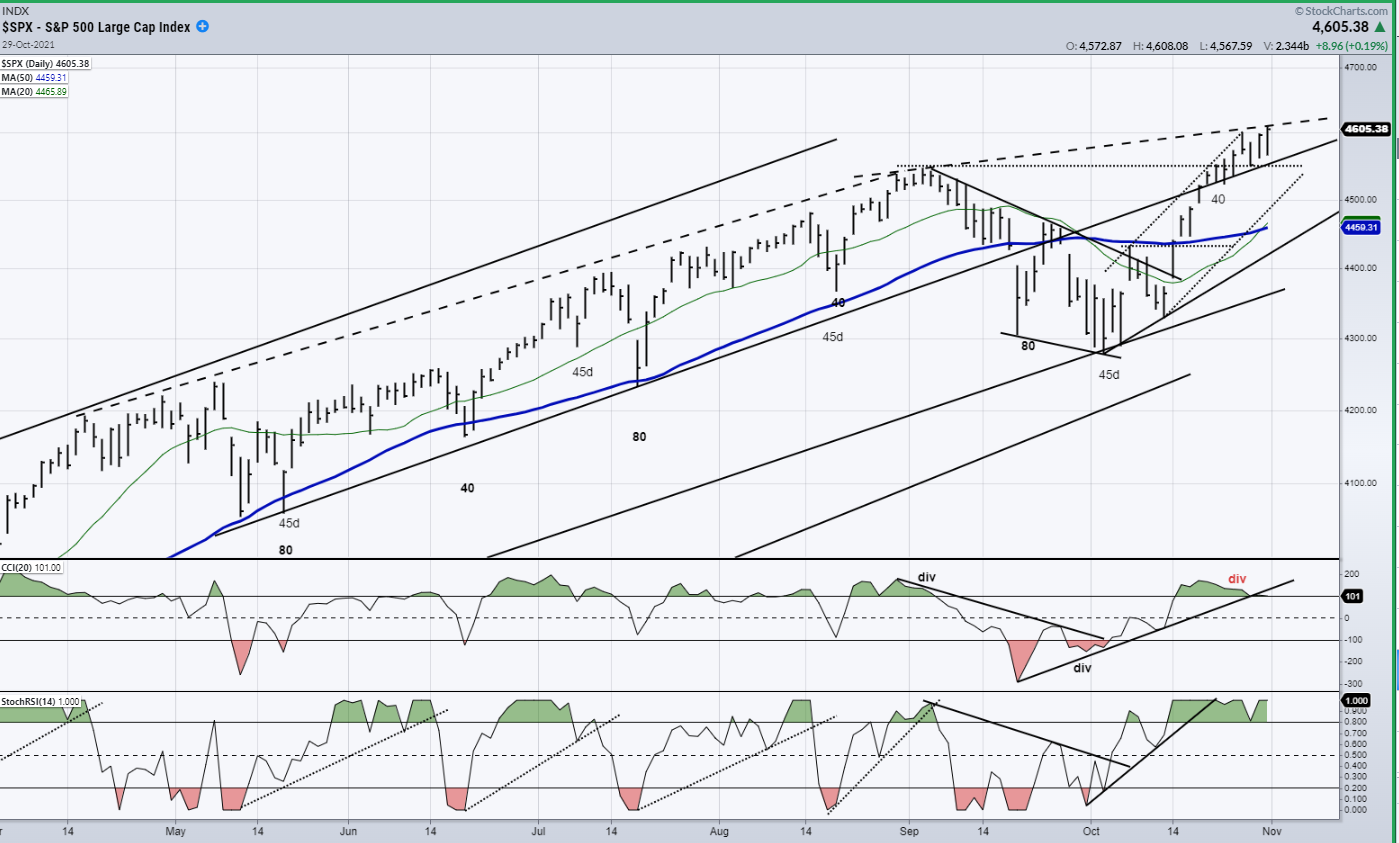
The trend from the March 2020 low has been so steep, that drawing a trend line from that low and connecting it with the latest correction low only produces two points and is therefore pretty much meaningless. That is why we have arbitrarily chosen to draw a trend line from the 3723-consolidation low, because it connects three points; and that makes it more reliable. I believe this is the trend line that will have to be broken before we can experience a significant correction in the “market”.
Now that we are getting very close to the 2020 P&F projection low of 4550, we may not have to wait too long before this takes place; although there is no guarantee that SPX will stop at that target, on the dime! P&F projections are best used as approximations, even though they, more than not, are filled exactly as projected, especially in smaller phase projections. Also, if you look at the DJIA chart above, it is obvious that it seems more and more ready for a reversal and, judging by the degree of deceleration which has been taking place since the current phase started in mid-June, it may not be too long before that occurs.
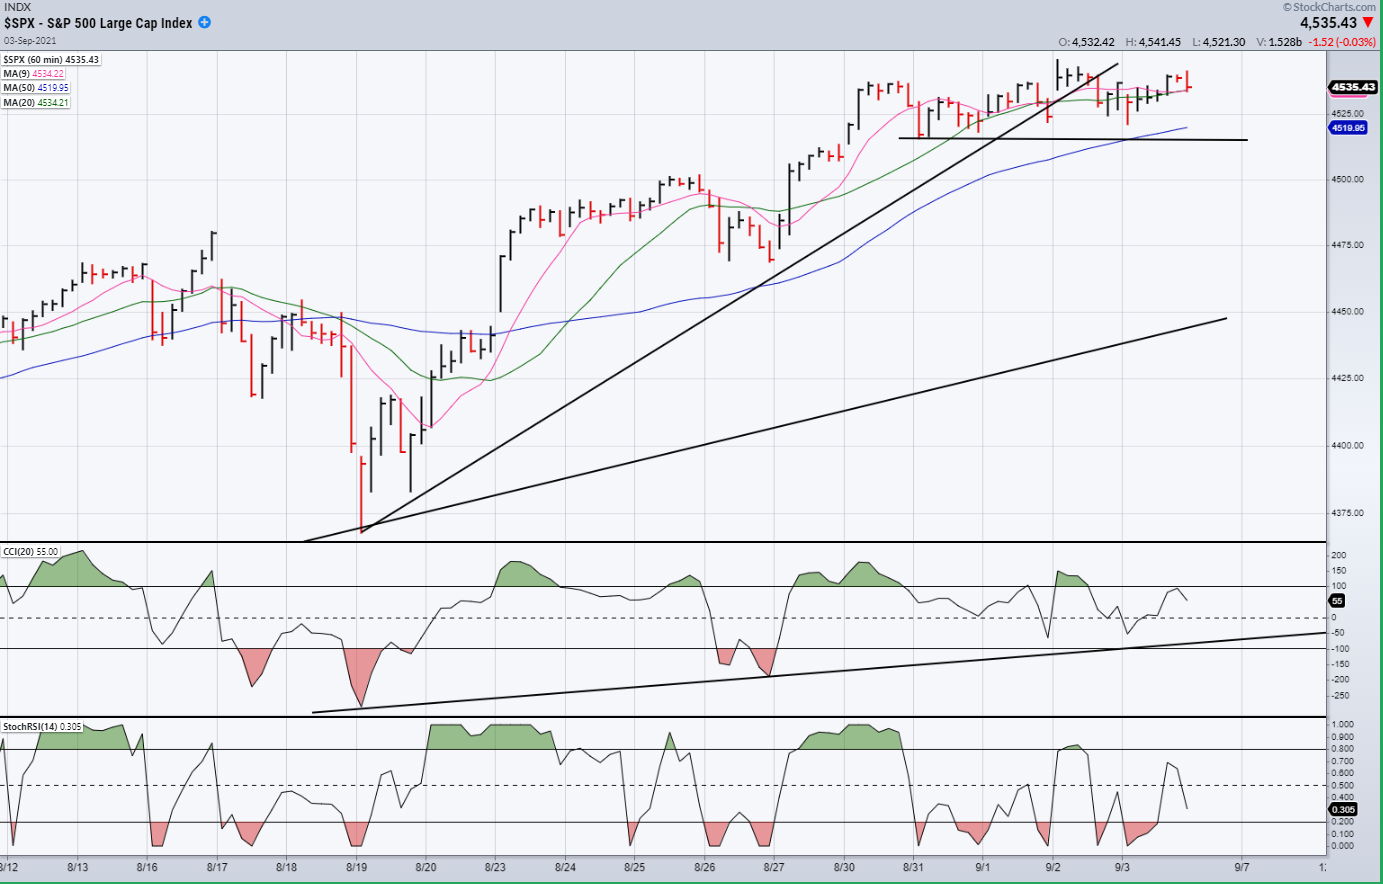
To that effect, it may behoove us to focus on the short-term trend and the current position of the short-term cycle, which is what we will do when we analyze the 60m chart, next!
(Click on image to enlarge)
SPX daily chart
The trend from the March 2020 low has been so steep, that drawing a trend line from that low and connecting it with the latest correction low only produces two points and is therefore pretty much meaningless. That is why we have arbitrarily chosen to draw a trend line from the 3723-consolidation low, because it connects three points; and that makes it more reliable. I believe this is the trend line that will have to be broken before we can experience a significant correction in the “market”.
Now that we are getting very close to the 2020 P&F projection low of 4550, we may not have to wait too long before this takes place; although there is no guarantee that SPX will stop at that target, on the dime! P&F projections are best used as approximations, even though they, more than not, are filled exactly as projected, especially in smaller phase projections. Also, if you look at the DJIA chart above, it is obvious that it seems more and more ready for a reversal and, judging by the degree of deceleration which has been taking place since the current phase started in mid-June, it may not be too long before that occurs.
To that effect, it may behoove us to focus on the short-term trend and the current position of the short-term cycle, which is what we will do when we analyze the 60m chart, next!
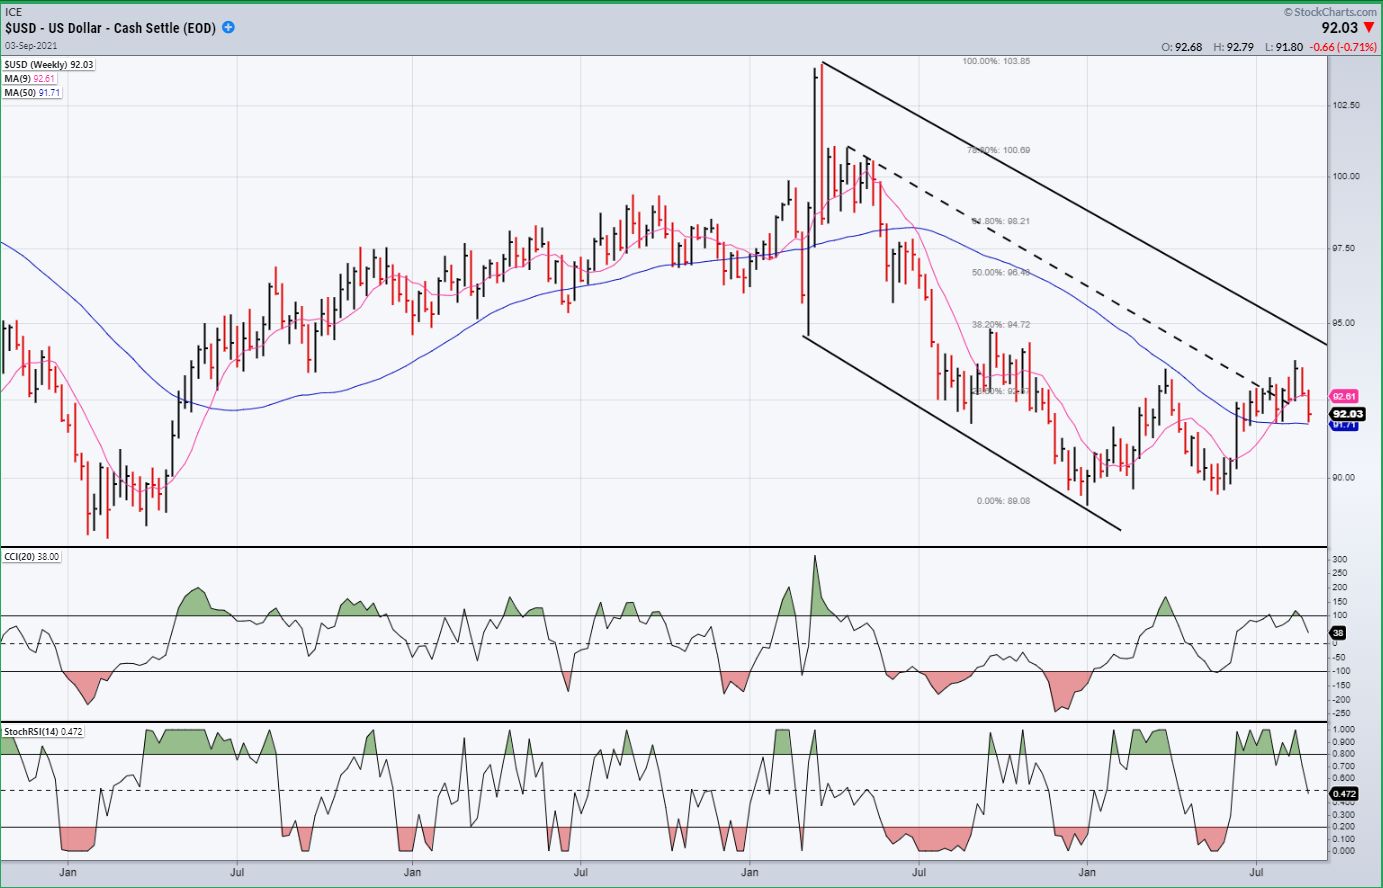
USD (dollar) dly
The dollar may have ended its attempt at challenging the corrective channel’s upper trend line, or it may simply be a pause in that process. A drop below the 50-dma which is currently providing support for the pullback could send the index back down toward the 90 lows.
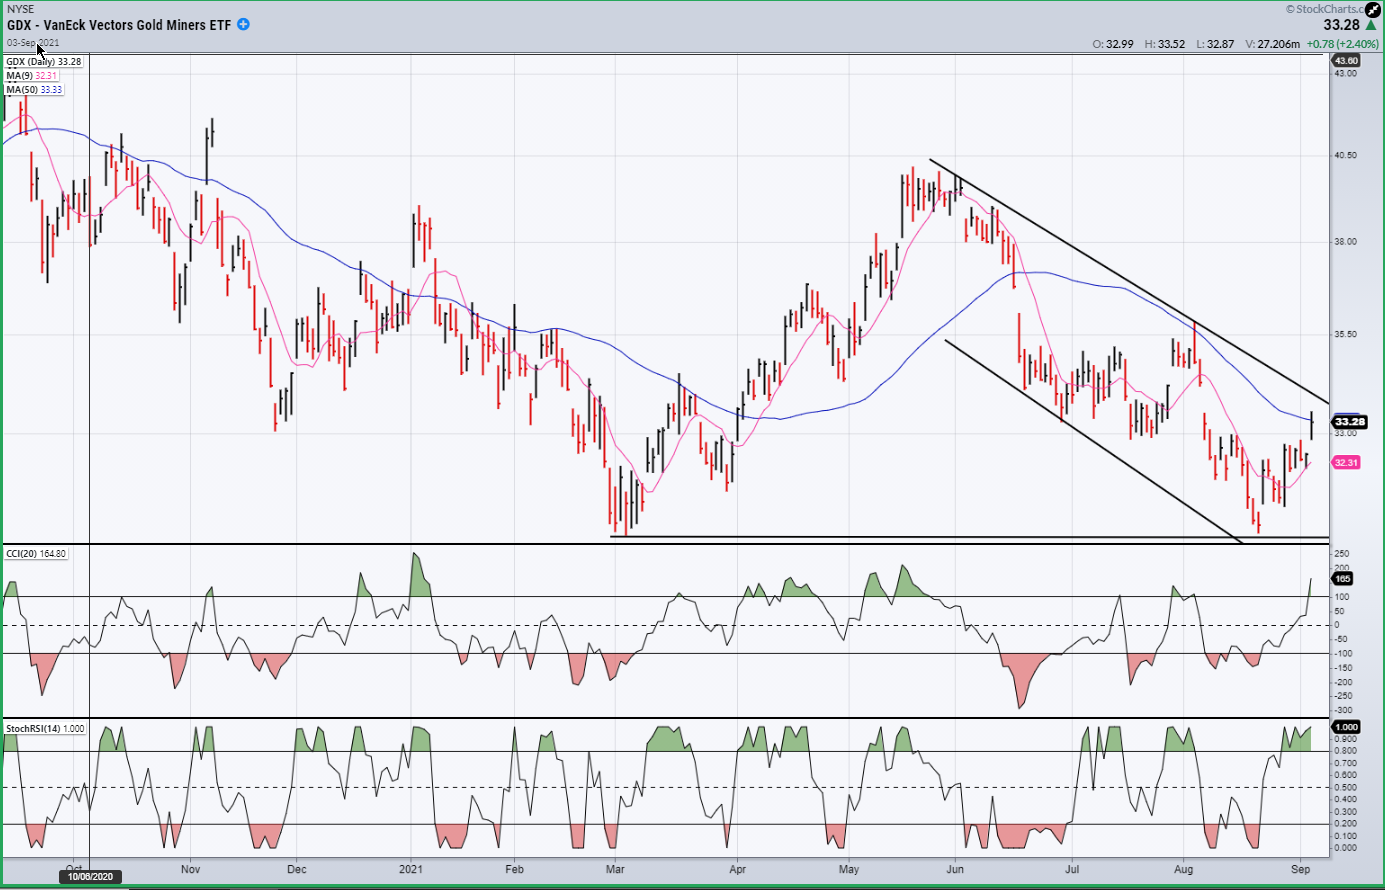
GDX (gold miners) (dly)
GDX is profiting from the pullback in the dollar and has risen to the top of its own corrective channel. It too has found resistance at the 50-dma, but Friday’s close was near the top of its daily range which makes Monday an important day to see if it can overcome the MA and challenge the top of the channel.
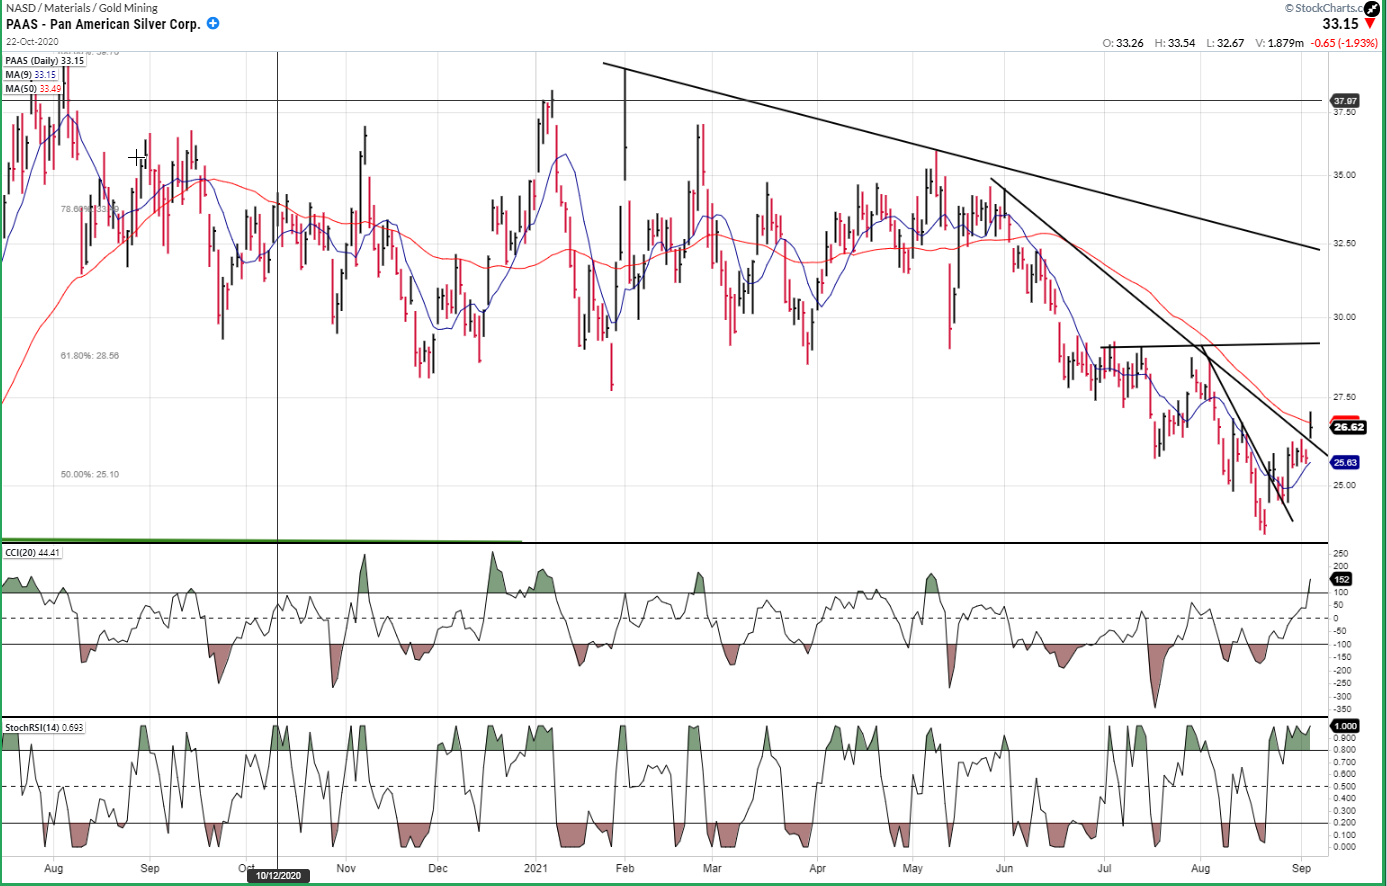
PAAS (dly)
PAAS has also profited from the retracement in the dollar and may be in a little stronger position than GDX because it has already risen well above its 50-dma and is trying to clear the 200-dma. Next week will be important for this index as well, to see if it can rise clear of the downtrend line which it has already broken.
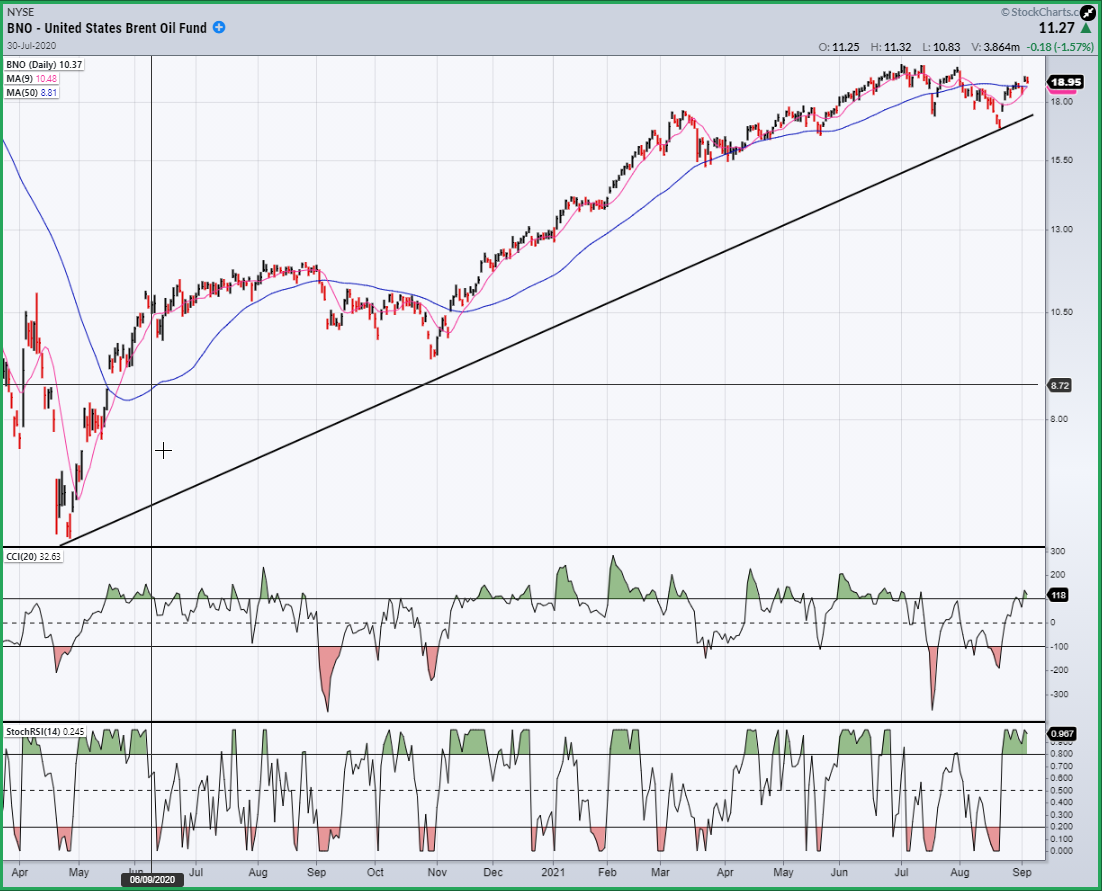
BNO (Brent oil fund) dly
BNO has reacted to the devastation in the oil industry caused by hurricane Ida. It has not yet conclusively established a new uptrend and may simply be expanding its top formation. The new trend line has been created which it has to hold.
Summary
Last week stated: “SPX is drawing ever closer to its long-term projection of 4550”, and this is where the last week of trading has taken it. It can now choose to expand up to, or a little beyond it, depending on how much upward potential remains in the short-term cycle.


Comments
Log in or sign up to join the conversation.