
A Major Technical Breakdown Just Occurred In Stocks
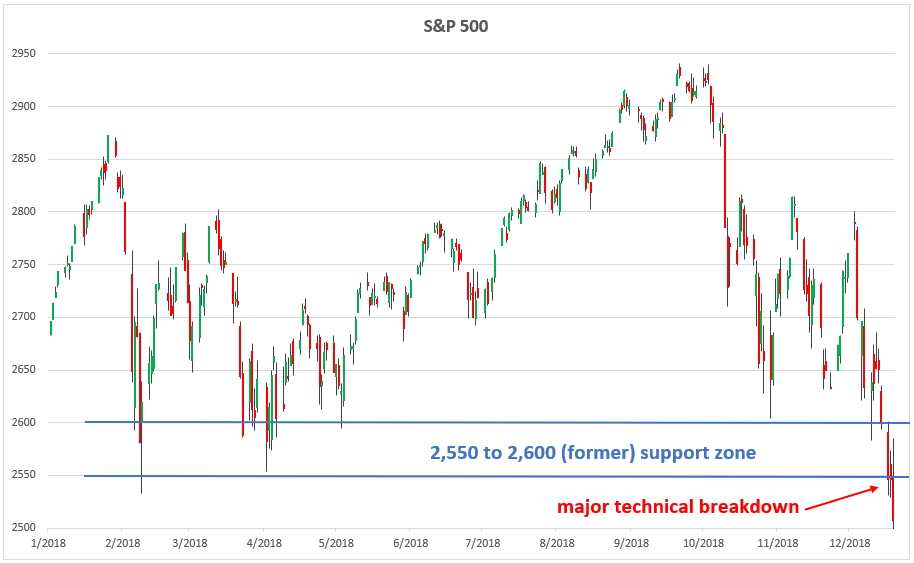
The much-anticipated December Fed meeting has finally come and gone, and the stock market did not like what it heard. The Fed raised rates by 0.25% and cut its expectation for 2019 rate hikes from two to three. Because the Fed didn’t sound as dovish as many investors would have liked, the S&P 500 promptly fell 1.54% to a fresh 2018 low. From a technical perspective, today’s action is extremely concerning because the S&P 500 broke the key 2,550 to 2,600 support zone that I’ve been showing for the past couple of months. Today’s breakdown increases the probability of further bearish action unless the index somehow manages to close back above that zone.
(Click on image to enlarge)
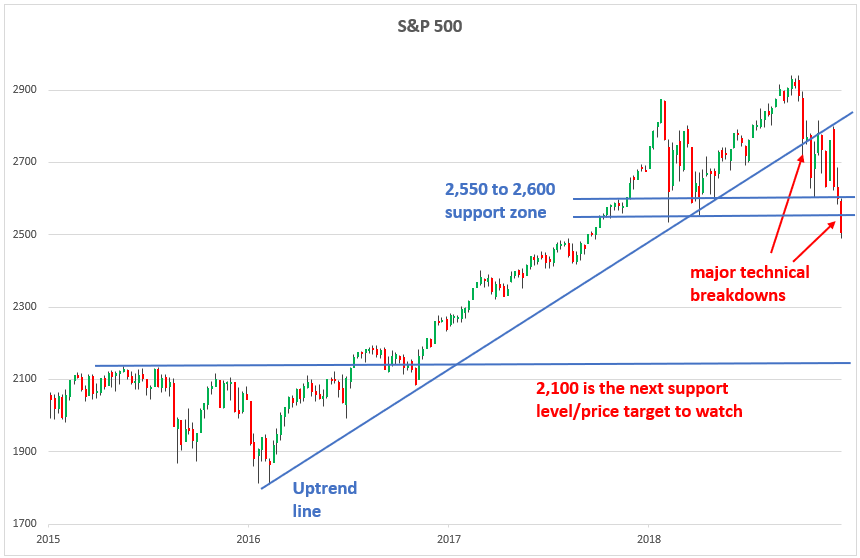
The longer-term S&P 500 chart shows how critical today’s breakdown is. Today’s breakdown is the second important technical breakdown in recent months (the first one being the break below the trendline that formed in early-2016, which I said was a bad omen). Assuming today’s breakdown remains intact, 2,100 (the 2015 and 2016 highs) is the next price target and support level to watch.
(Click on image to enlarge)
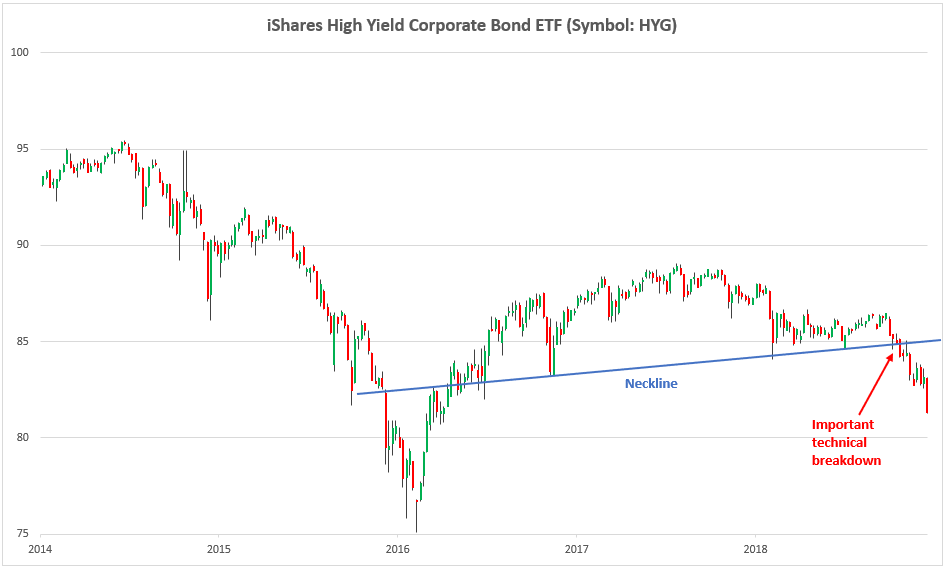
High-yield or “junk” bonds continue to sink, which I’ve been saying is a sign that the U.S. shale energy bubble is about to burst:
(Click on image to enlarge)
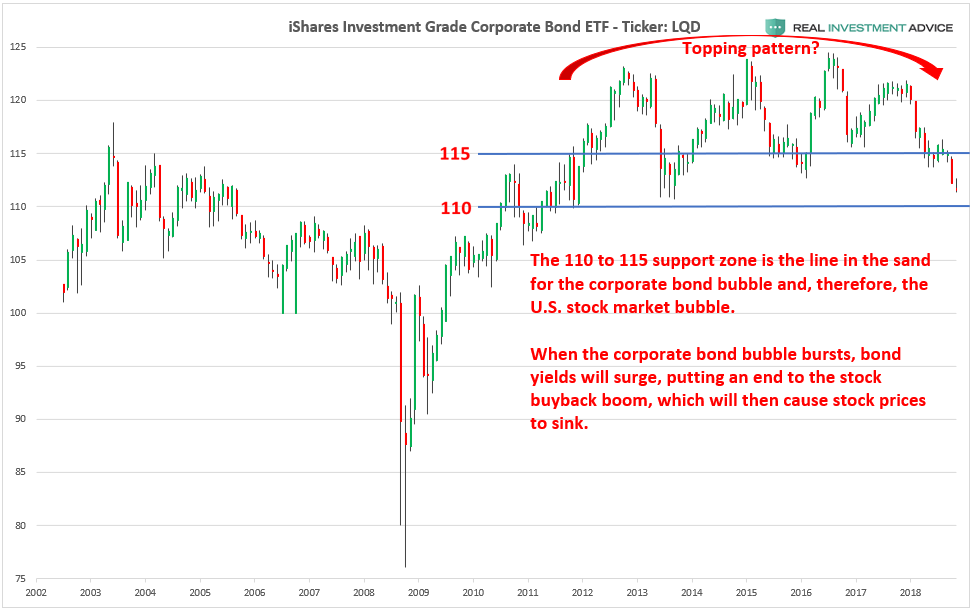
Investment grade bonds are not falling quite as hard as high-yield bonds, but that could change if the LQD iShares Investment Grade Corporate Bond ETF breaks below its 110 to 115 support zone, which would foreshadow an even more powerful bond and stock market bust ahead as bond yields spike and stock buybacks grind to a halt (I explained this scenario in more detail a few weeks ago).
(Click on image to enlarge)
For the author's full disclosure policy, click here.


Not sure if there are any upcoming catalysts to garner strength...of course if the market wants to go up, it will find one.
A good thought.