
A Decade After Lehman’s Collapse, $133M Loss Overwhelms A Clearing House
Talking Points:
- $133 million trade loss was enough to wipe out safeguards maintained by the clearing house
- The event will draw the scrutiny of regulators looking to avoid similar instances
- The inability of the clearing house to cover the losses suggests some of the same risks remain 10-years after the Great Financial Crisis
Energy Derivatives Trade Gone South
As we approach the tenth anniversary of the collapse of Lehman Brothers, an event that generated intense scrutiny for banks and exchanges, a single trader was able to empty the contingency fund of clearing house just this week. Einar Aas was one of Norway’s wealthiest individuals and was able to wipe out Nasdaq’s 7 million euro default fund. The position cut also through 107 million of the 166 million euro mutual default fund that clearing house members must contribute to. To cover the lapse, Norway’s state owned power giant Statkraft is among the members who will have to cover the loss. Aas himself has been barred from the exchange and will likely face bankruptcy but the more troublesome conclusion for markets is the weakness of the clearing house.
The realization that one trade from an investor can wipe out a clearing house’s safeguards is very worrisome. Although the trade loss obviously pales in comparison to the events of 2008 and the collapse of Lehman Brothers, it may suggest some of the same financial risks have not been fixed.
10th Anniversary of Lehman’s Collapse
On September 11th, 2008 Lehman Brothers put itself up for sale. After no buyers materialized, the firm filed for chapter 11 bankruptcy on Saturday the 15th, 2008. The chapter 11 filing marked the largest such filing in history. It also allowed Lehman to close its doors on 100,000 creditors and over $600 billion in debt.
Following Lehman’s collapse, a domino effect of financial unraveling occurred. Also on September 15th, Bank of America acquired Merrill Lynch for $50 billion. On September 17th, the US government seized control of AIG. The following days saw the Fed create AMLF and the treasury provide plans to guarantee money market investments.
Dow Jones Price Chart September 2007 – March 2009
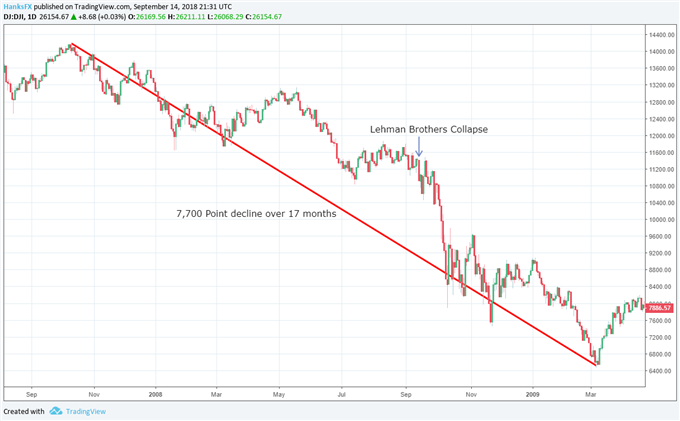
Dow’s Decline
The subsequent weeks saw the Dow tumble roughly 2,000 points by October 8th when the Fed cut the fed funds rate to 1.50% from 2.0%. On a broader scale, the Dow shed around 7,700 points from its height on October 11th, 2007 at 14,190 to its lowest on March 6th, 2009 at 6,475.
Since then, the Dow has climbed over 270% to close above 26,150 into the weekend. Still, events like Einar Aas’s blown up trade remind us that we are not that far from 2007 in some regards.
Disclosure: To read up on the current climate for the Dow Jones, check out James Stanley’s article more


Wow, this will not foster confidence!