
A Bullish Scenario For Stocks
While we make decisions based on observable evidence (rather than forecasting), it is always a good idea to understand bullish and bearish possibilities.

One bullish scenario that could enable the broad market to break from its recent ten-month period of consolidation (see red arrows in chart above) goes something like this:
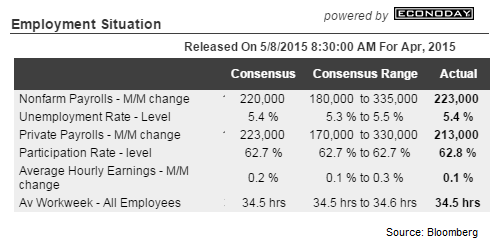
- If you were concerned about the economy, the last major piece of economic data did not fall into the “imminent recession” range. Last Friday’s widely anticipated monthly labor report showed a gain 223,000 jobs.
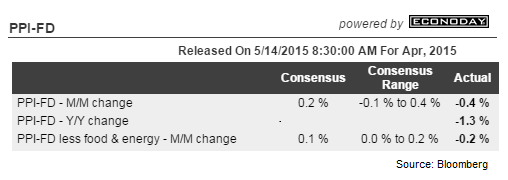
- If you were concerned the Fed would raise interest rates in June and kick off a stock market correction or bear market, Thursday’s Producer Price Index (PPI) provided the Fed with “we may be able to hold off on raising rates” figures on inflation.
The Last Shakeout Before A Breakout?
The chart below shows what appears to be a “shake out of fear” pattern over the last eighteen days. All of the above means little if the S&P 500 cannot break above and hold above 2117.

As outlined in detail on May 8 in our weekly stock market video, the weight of the evidence still favors a bullish breakout over a bearish breakdown. Could the bears gain some traction? Sure they could, but we need to see evidence, rather than anticipate what may happen.
Disclosure: This post contains the current opinions of the author but not necessarily those of Ciovacco Capital Management. The opinions are subject to change ...
more

