
A Bond Market Turkey Call
Over the River and Through the Woods (to municipal bonds we go)
Municipal bonds have come under pressure as investors, with the urging of some wealth management firms and their models, have pulled money from the municipal market in anticipation of lower taxes under a Trump presidency. I believe this may be a knee-jerk overreaction. For one, demographics augur for high allocations to bonds for the next two decades. Secondly, even when we consider lower personal income tax rates, municipals remain attractive.
On a risk versus reward basis, in an era of aging demographics, which cries for income-generation, munis look attractive. This is true, even when one considers potentially lower taxes from the Trump Administration. It was not all that long ago, that Muni yields traded through UST yields.
Spreads between AA municipal benchmarks and UST benchmarks since 2002 (BAML)
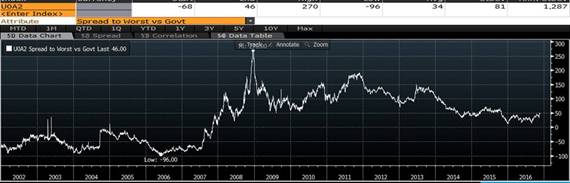
On the 10-year area of the curve, AA-rated Muni GOs are between 30 and 35 basis points over the 10-year UST note.
Gross yields of AA Muni GOs vs. UST benchmarks (Bloomberg):
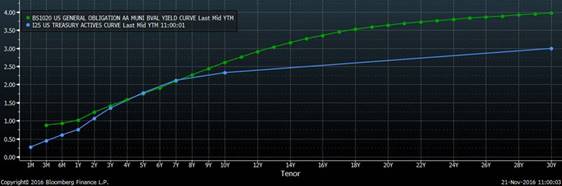
AA-rated 10-year muni GOs yield between 2.60% and 2.65%. This equates to about a 3.90% yield at a 33% tax rate (lower top rate, under the Trump Plan). Ten-year A-rated corporates are only yielding in the mid-3.0%s. Munis are a bargain, even in a lower tax-rate environment, versus corporates but you would not know it by listening to the portfolio strategist folks who are myopically focused on near-term price movement. According to the plan put forth by president-elect Trump, the 33% tax rate will apply to individuals with earned income of $225,000 and higher. This encompasses a wide swath of potential fixed income investors. Instead of running away from municipal bonds, many investors (depending on investment goals and tax situation) should be running to municipal bonds.
Turkey Call
What about the end of the “bond bull market.” When the Fed Funds Rate was in a range of 0.00% to 0.25% and the 10-year UST note yield was below 2.00% (and 1.50%), it did not take a rocket scientist to figure out that the ability for bond prices to rise from these levels was limited. However, the end of a bull market in bonds does not necessarily portend a bear market.
UST 10-year note yields since 1990 (Bloomberg):
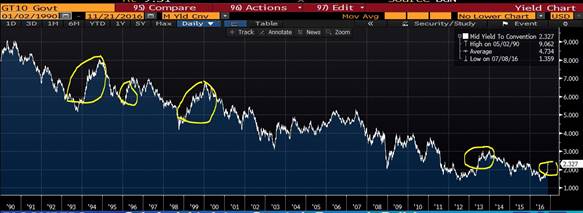
Each one of the circles on the above chart mark rising interest rates/bond yields and warnings of an end to a bond bull market/reversion of interest rates. I could also put a circled around 2003 when several Making Sense readers forwarded a newsletter to me which stated that the Fed’s decision to lower the Fed Funds Rate to 1.00% portended a multi-decade reversion back to 1980-like interest rates (probably the least intelligent hypothesis I have read during my nearly three decades in the fixed income markets).
What each of those circles actually represent are cyclical increases to interest rates. The one consistency among the first three circles is that they marked the end of an economic expansion cycle. I believe this is true even of the rate rise between 2012 and 2014. Yes, the Fed was tapering, but economic activity peaked in 2014 and slowed with the ending of the domestic energy super-cycle.
I believe that it is more than likely that what we are witnessing is not a long-term bond bear market, but the latter stages of a rate/economic cycle. If history provides us with any clues it might be that we have already seen the majority of long-term interest rate increases we can expect to see during the remainder of the current interest rate/economic cycle. In my opinion, for the remainder of the current economic/interest rate cycle, the majority of rate increases should occur on the short end of the yield curve. There has been some evidence of that in recent trading sessions.
UST yield curve, 2-years to 10-years since 11/1/16 (Bloomberg):
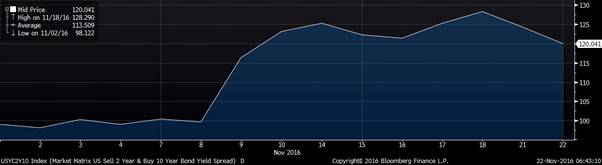
As you can see, the yield curve steepened, sharply, following Election Day results, but had mostly flat-lined until late last week. Since last Thursday, the UST so-called benchmark curve has flattened. This has occurred via the 2-year UST yield rising while the 10-year UST yield has remained little changed, over the past several trading sessions. This trend appears to be due to the bond market pricing in a nearly 100% probability of a Fed hike in December and multiple rate hikes in 2017. Recent Fed jawboning has alluded to the Fed becoming more aggressive in monetary policy tightening in response to pro-inflationary policies suggested by the incoming Trump Administration.
Typically, the economy experiences a period in which monetary and fiscal policies are rowing in the same direction. However, for the past eight years, the economy had experienced monetary policy stimulus while fiscal policy has leaned toward austerity and increased regulation. Still, the U.S. economy may be nearing full capacity, a point mentioned by several Fed speakers. As such, the Fed is prepared to renormalize policy at a time fiscal stimulus is finally a real possibility. Thus, while the presence of monetary stimulus and lack of fiscal stimulus had the economy moving forward in a circular motion, the U.S. economy expanded to the point where it might be nearing full capacity, albeit slowly and over an extended period of time.
Disclaimer: The Bond Squad has over two decades of experience uncovering relative values in the fixed income markets. Let us work for you. more


