3 Reasons Why Gold Will Be Shining Soon
It has been a frustrating year for gold bulls. Every attempt of gold to move higher was short-lived, the spring rally was the strongest one of the year but was capped. The key ‘event’ is gold’s inability to clear former ATH. So far the bad news. The good news is that all signals suggest a strong 2022 for gold. This article highlights the 3 most important drivers for gold to push higher starting in the not too distant future. The detailed version of our viewpoint is documented in our 2022 gold forecast, this article provides a summary of the most important gold price drivers.

Image Source: Pixabay
Gold has many influencers which makes it challenging to analyze and forecast.
In essence, the price of gold is heavily influenced by currency and credit markets. The issue is that sometimes currencies but other times credit markets drive the price of gold. Good luck getting those gold predictions right.
If anything, the 2021 gold market was characterized by a heavy pushback of the US Dollar. It might be that the USD has ‘only’ risen 6% this year but it appeared to be more than enough to hold gold ‘down’.
Bond yields as per 10 year Treasury yields did come down more than 30% around summer time. Combined with a soft USD it was the perfect setup for gold and silver to shine. It did not happen, and we took notice of it.
We conclude that the USD will continue to push back precious metals until it decelerates or turns flat. That’s when we will be paying attention. That’s when we expect gold to finally take off, and the gold charts will guide us for the final confirmation of gold’s continued bull run.
We expect this to start in the first half of 2022. No, this will not come with a market crash which is what many are talking about currently. As explained in great detail we expect a stock market crash to start in the 2nd half of 2023.
As per our market readings there are 3 drivers behind the gold market.
Driver #1: USD
First, as said, the US Dollar needs to calm down. It has a very bullish setup as seen on the daily chart.
(Click on image to enlarge)
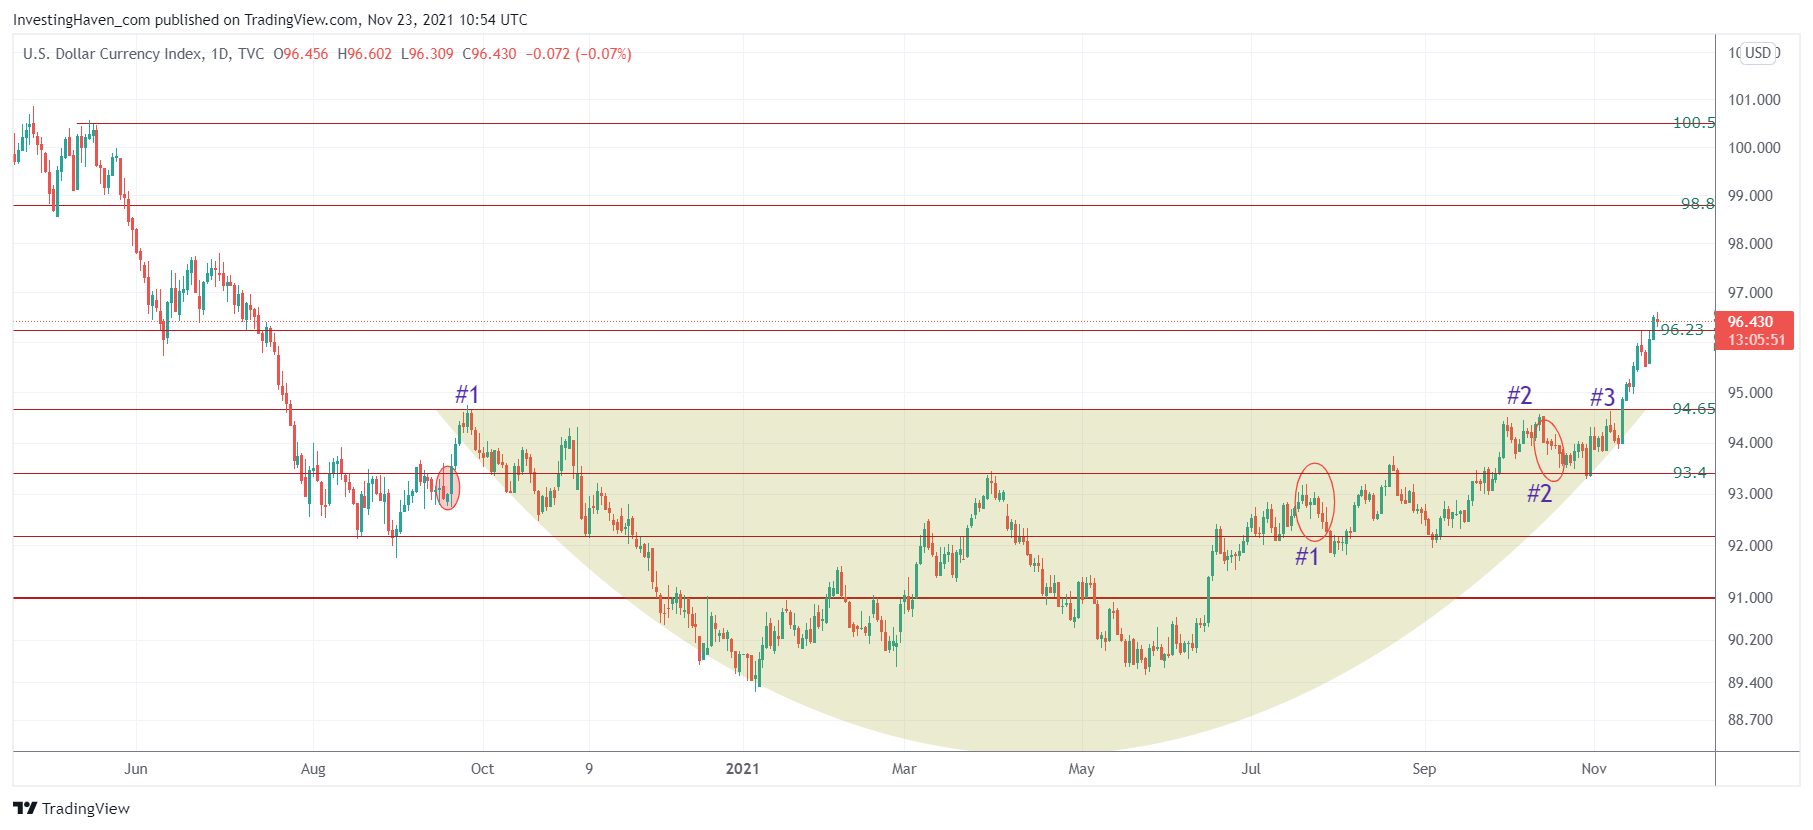
The USD is likely on a mission to move to 100 points (approx.) where it should start decelerating. We expect a similar outcome as in 2019: after a fast rise of the USD it started decelerating its uptrend. That’s when precious metals started shining, but not before.
Driver #2: Gold chart patterns
Second, the gold chart itself has lots of valuable information.
The daily gold chart on one year shows a trendless gold market. There is nothing exciting to see here. Right?
Well, not too fast, we like the higher lows on this chart. This sets the stage for exciting things to happen in the future provided the series of higher lows continues.
(Click on image to enlarge)
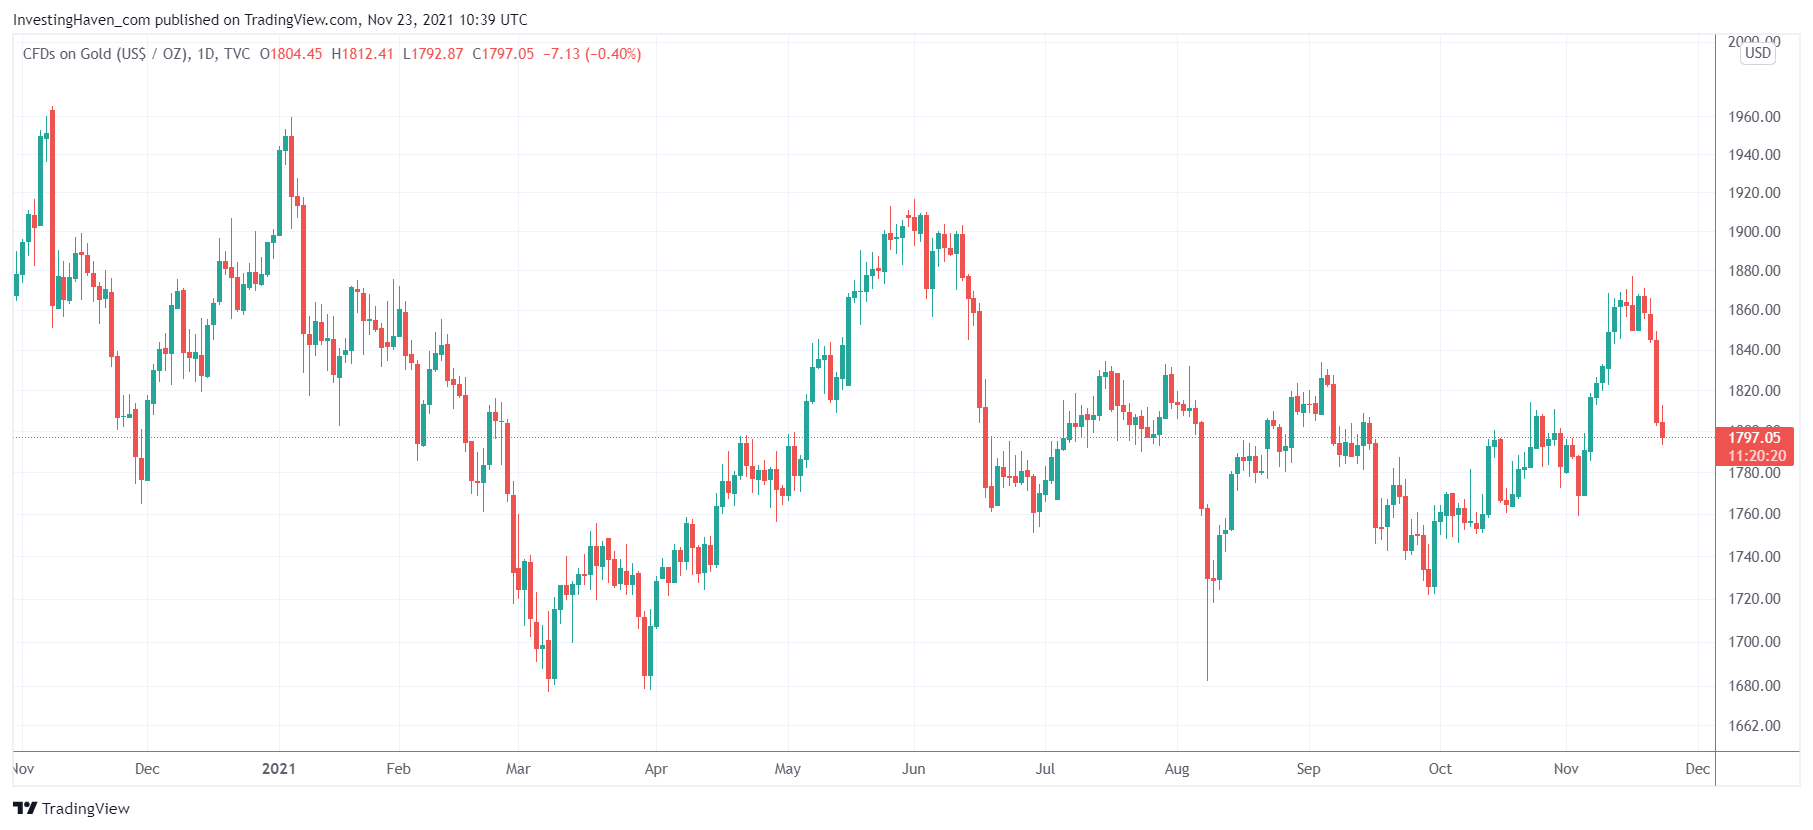
If we zoom out just a little bit you will see our point. 2021 is not bad as reversal, is it?
(Click on image to enlarge)
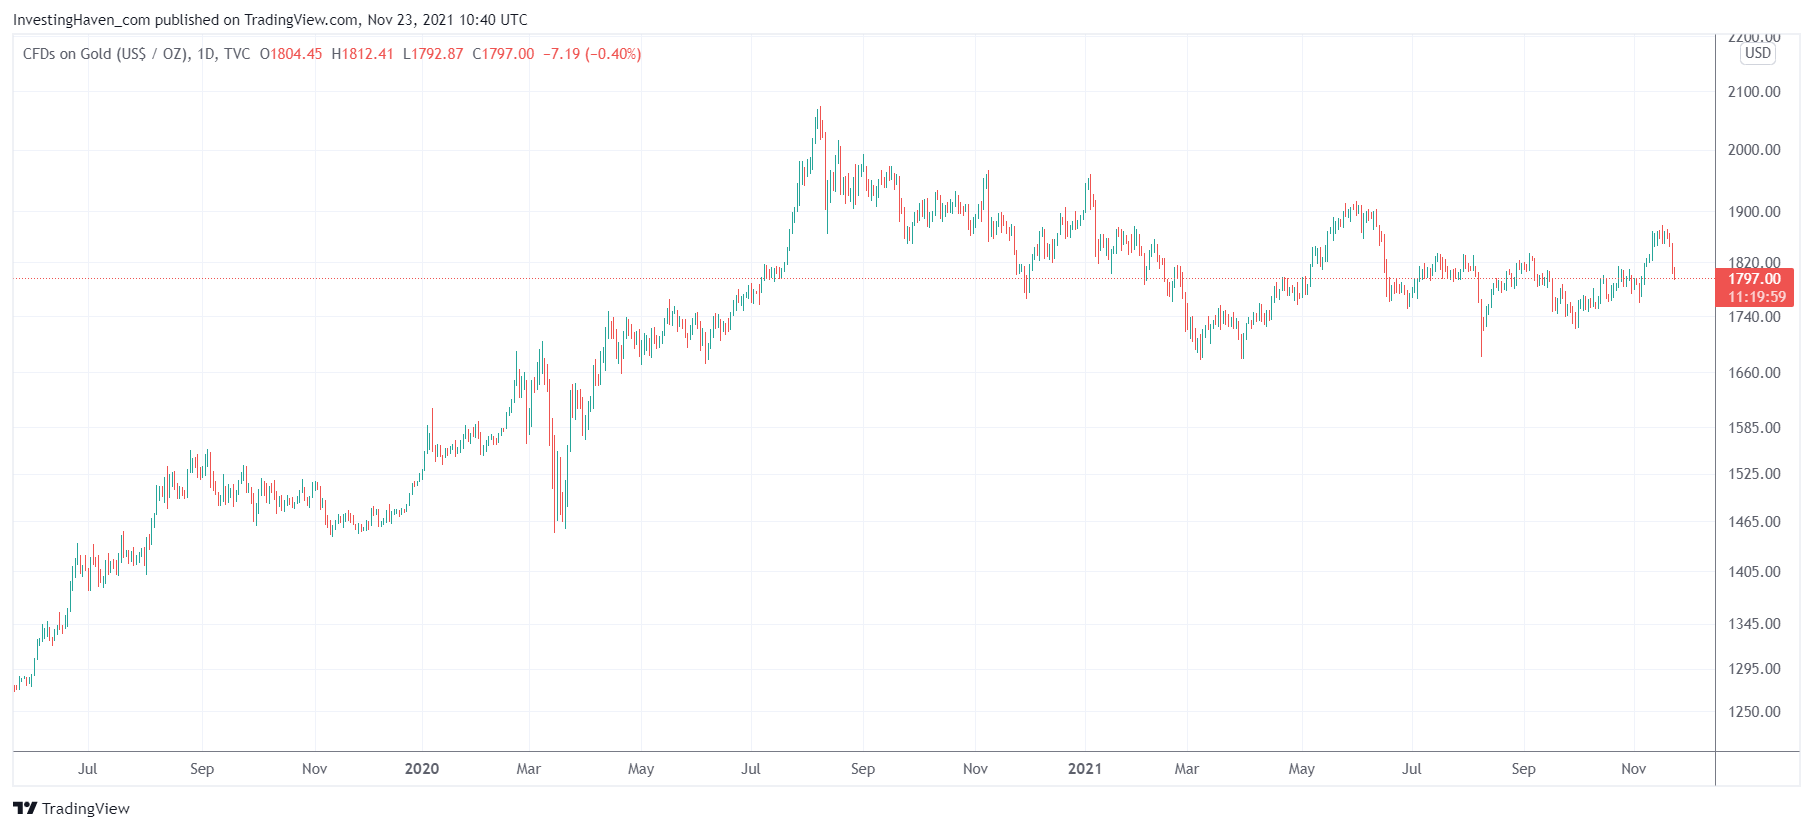
We then overlay some structure in the form of patterns on the 3 year chart. This starts making us excited as analyst/investors. There is a solid bullish reversal right below former ATH (2011), that’s not good… it is GREAT.
(Click on image to enlarge)
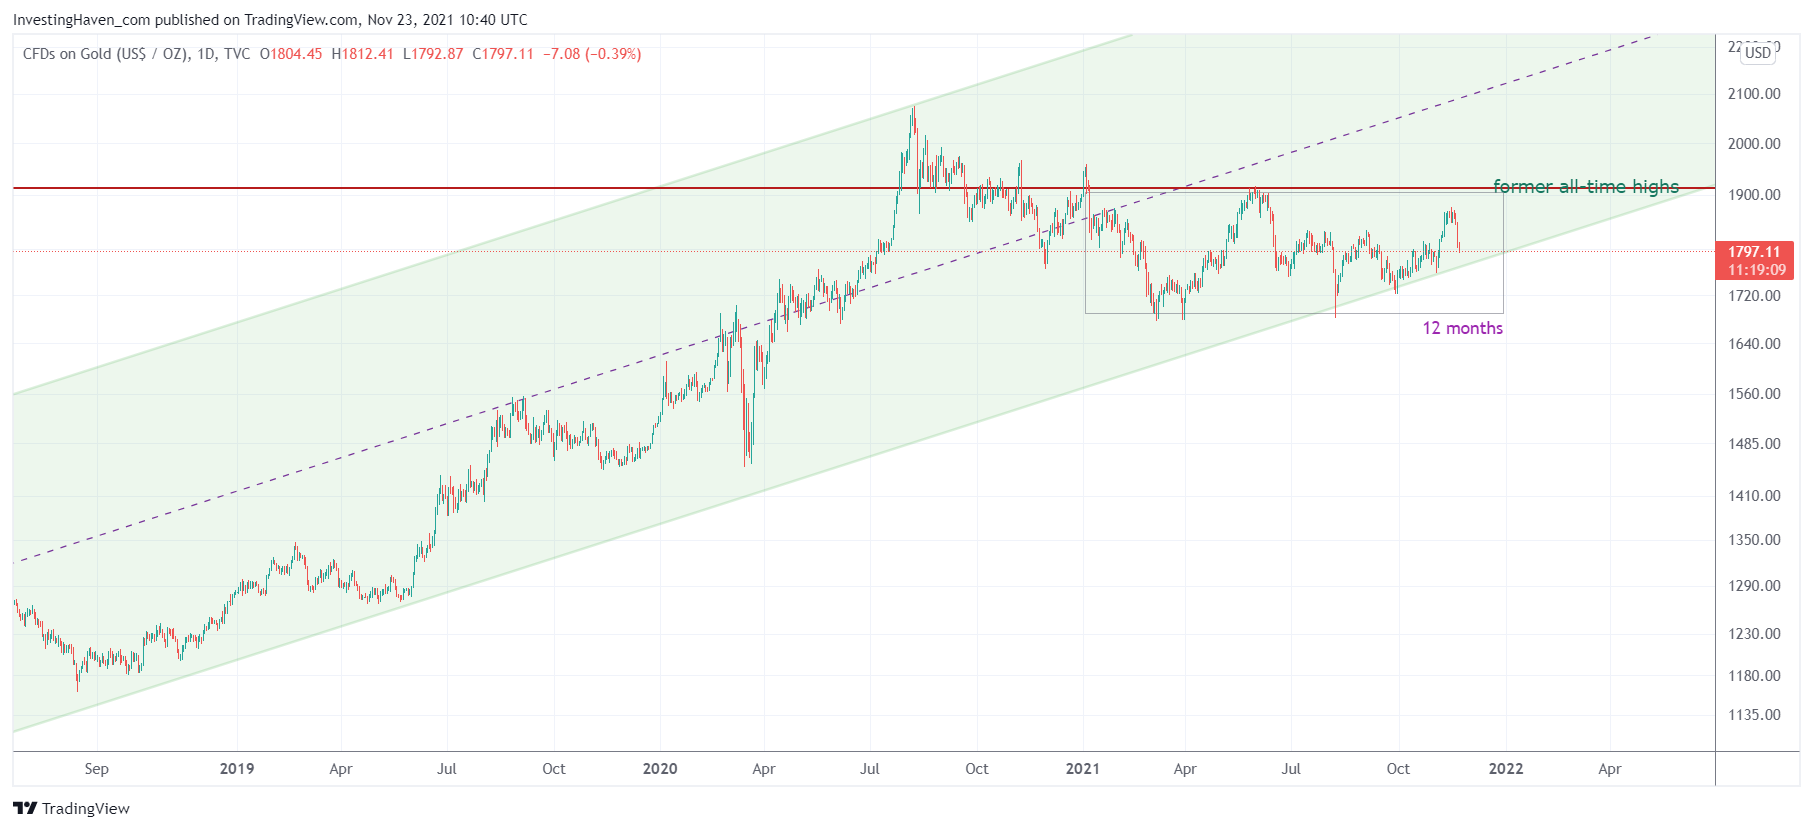
There is still work to do (by the market, not by us) before a bull run can start. It will take a few months is our best guess. But everything is lined up for a gold bull run in 2022.
Do we see a huge cup and handle formation on the monthly chart? Yes, we do!
(Click on image to enlarge)
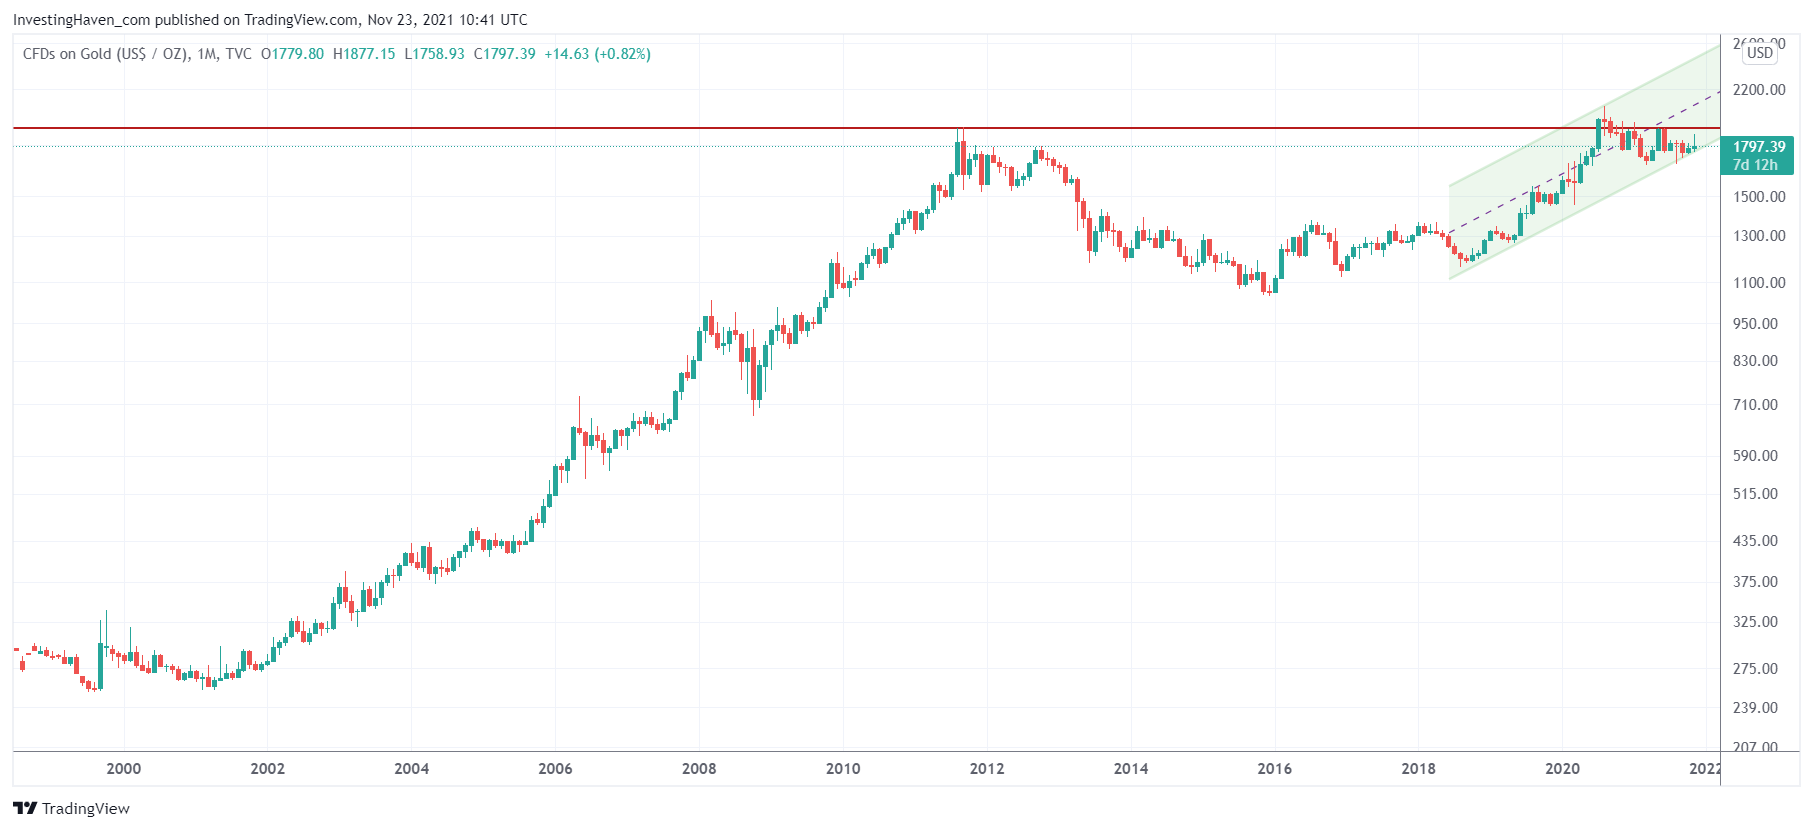
The higher the timeframe the stronger the impact of the chart pattern. The quarterly chart of gold is truly phenomenal. It reminds us to some extent the Bitcoin chart a year ago right before BTC started an epic run from 12k to 64k.
(Click on image to enlarge)
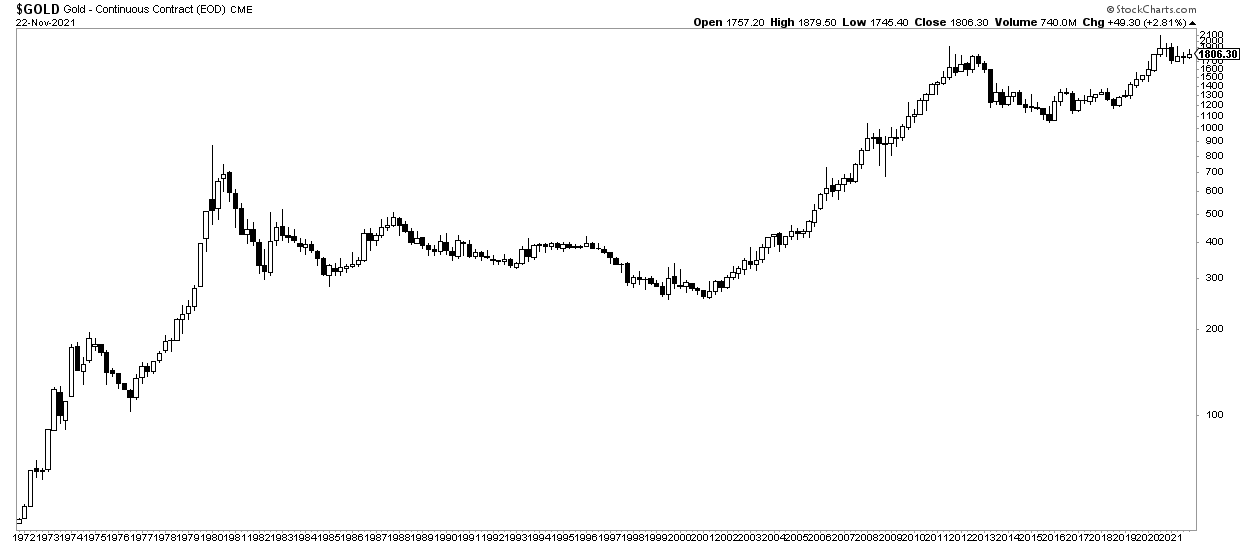
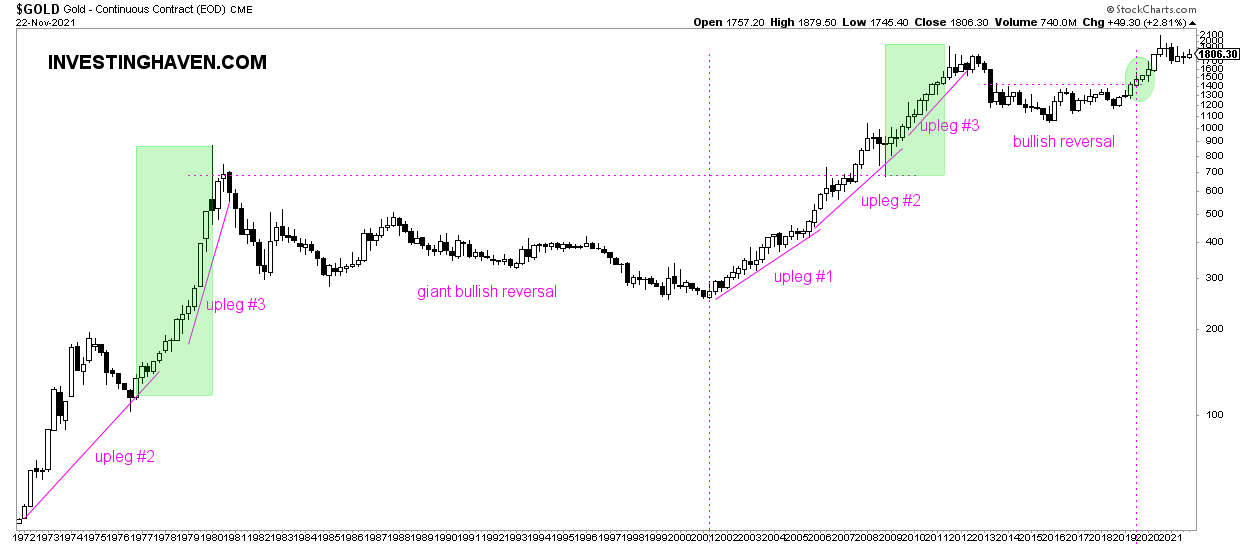
We do know from history that a market accelerates over time. So, the fact that gold is trendless in 2021 is not a bad thing, it is inherently a good thing. Because any bull market goes through a few phases, and each phase sees an acceleration of the uptrend. We expect gold to accelerate, and the prerequisite for this to happen is a flat period followed by a break above former ATH. This will mark the start of a bull run which should bring the price of gold to our first target which is $2,400 to $2,500.
(Click on image to enlarge)
Driver #3: Monetary inflation
Third, other than the gold chart patterns and the influence of the USD we also see a driver for gold in the field of inflation. We do realize that ‘inflation‘ is a very loaded word. Moreover, it can be interpreted in different ways.
We look at the correlation between inflation expectations (as per TIP) and the gold price. Both are set to move higher as per the current chart readings on the long-term chart.
(Click on image to enlarge)
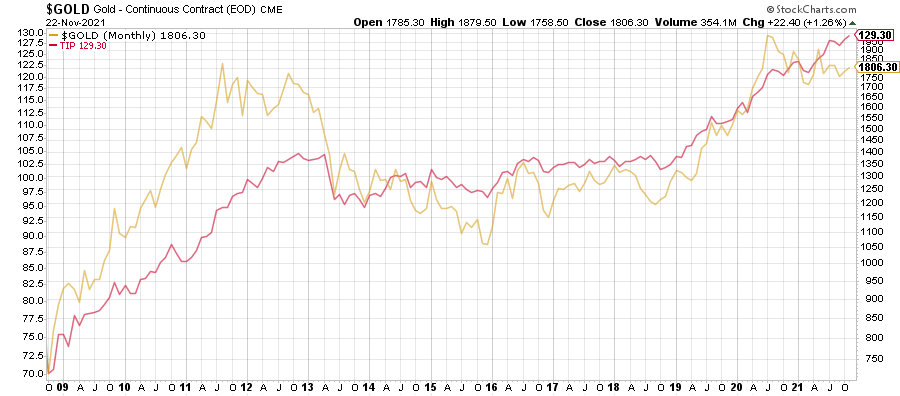
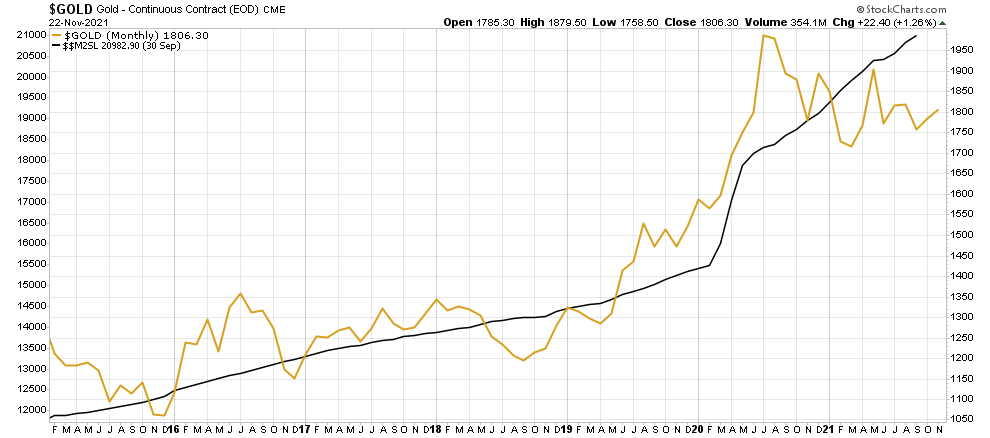
More importantly, according to us, is monetary inflation. We depict M2 on the next chart which got a serious boost last year and continues to rise. Gold is positively correlated to M2. Any divergence between M2 and the price of gold over the long term was short-lived. We expect this correlation to drive gold higher in 2022.
(Click on image to enlarge)
In terms of investment opportunity, we are very focused on the gold and silver mining space. Those stocks tend to be violent, in both directions, so you better get your entry point right.
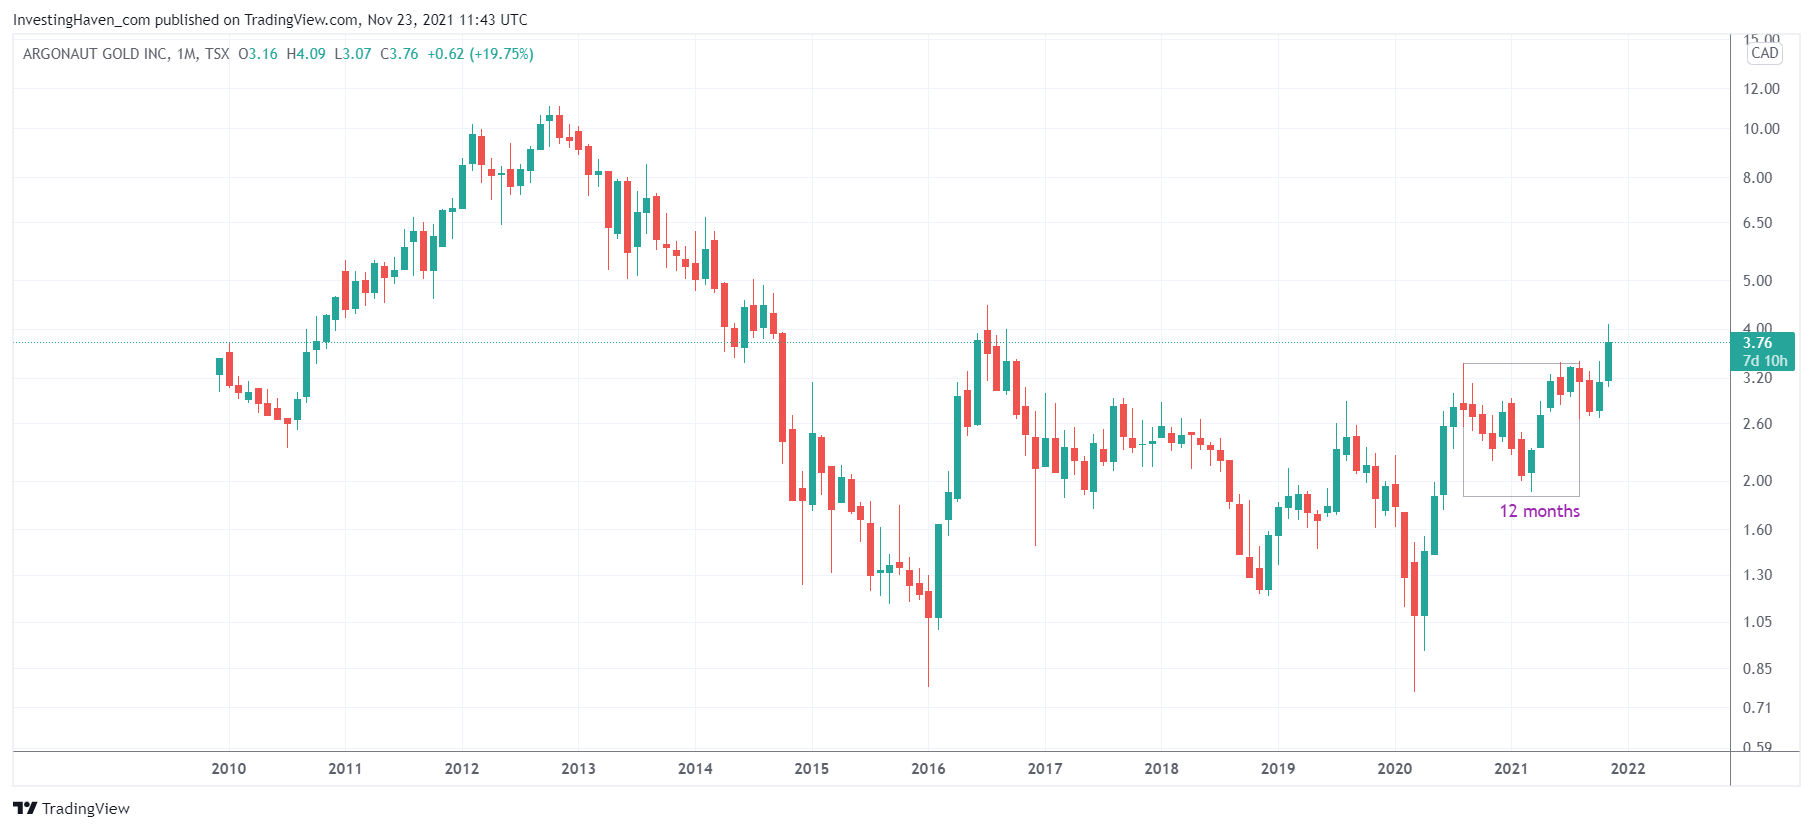
That said, we are on the lookout for gold and silver mining charts that have a long-term bullish reversal on their weekly and monthly chart. One such example is Argonaut Gold, the monthly chart is phenomenal. It will only break out once gold starts preparing its bull run (miners have a track record of front running bullion when bigger bullish run start).
(Click on image to enlarge)
All we have to do as investors is be patient and be focused on the gold chart for a confirmation of the start of the gold bull run. Although this sounds easy it is (by far) the most challenging thing to do for the average investor.
More investment tips in our blog post 7 secrets of successful investing.
Disclaimer: InvestingHaven.com makes every effort to ensure that the information provided is complete, correct, accurate and ...
more


Good article, thanks for sharing.
Excellent read and exactly right.
