U.S-China Trade Shows Nominal Improvement In June 2022
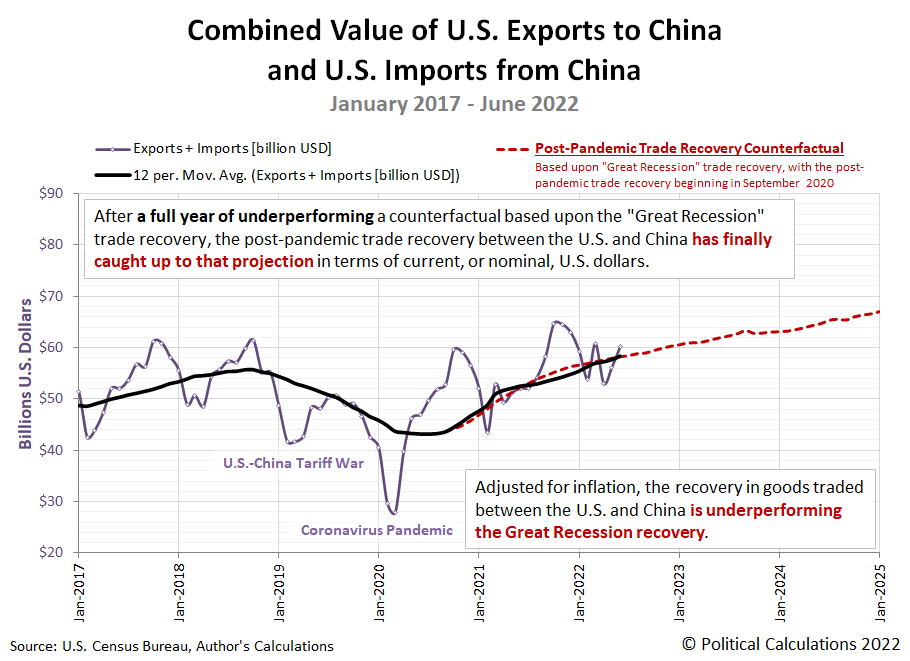
After a full year of underperforming a counterfactual based upon the "Great Recession" trade recovery, the post-pandemic trade recovery between the U.S. and China has finally caught up to that projection in terms of current, or nominal, U.S. dollars.
Digging into the trade data, we found the basis for that improvement is rather lopsided. Most of the improvement in recent months has been paced by double-digit year-over-year growth in the value of goods imported into the U.S. from China. By contrast, growth in the value of goods exported by the U.S. to China has been much slower and nearly flat on average.
Much of this lopsided outcome is the result of clearing a good portion of the backlog of container ships that stacked up outside west coast U.S. ports in late 2021.
None of the trade data we've presented has been adjusted to account for President Biden's inflation. There's little question that in real terms, the post-pandemic trade recovery between the U.S. and China has some way to go before catching the counterfactual in real terms. This is to say the U.S. is paying much more to import fewer things from China.
References
U.S. Census Bureau. Trade in Goods with China. Last updated: 4 August 2022. Accessed 4 August 2022.
More By This Author:
The S&P 500 Casually Heads HigherHighest U.S. Mortgage Rates Since 2008 Sends Demand, New Home Prices Plunging
Median Household Income In June 2022
Disclosure: Materials that are published by Political Calculations can provide visitors with free information and insights regarding the incentives created by the laws and policies described. ...
more


