
Trucking Industry Growth Still Mixed In August 2019
Headline data for the American Trucking Association (ATA) tonnage declined but remains in expansion whilst the CASS Freight Index reported the year-over-year growth rate continues in contraction.

Analyst Opinion of Truck Transport
The CASS index is inclusive of rail, truck, and air shipments. The ATA truck index is inclusive of only member movements.
I tend to put a heavier weight on the CASS index which continued in contraction year-over-year. On the other hand, the ATA index is in an uptrend. The ATA index remains an outlier on the positive side - and is contrary to almost every economic data point.
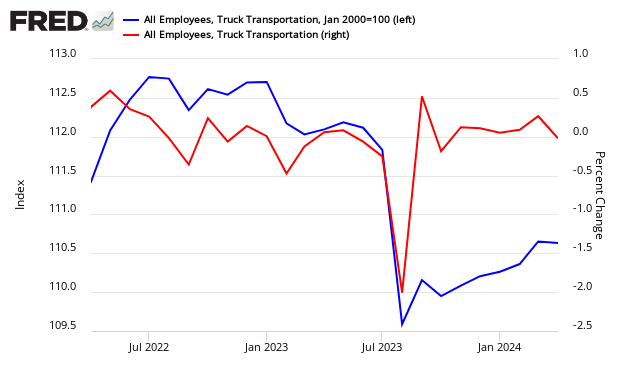
Econintersect tries to validate truck data across data sources. It appears this month that truck employment rate of growth continues to slow. Please note using BLS employment data in real-time is risky, as their data is normally backward adjusted (sometimes significantly).
(Click on image to enlarge)
ATA Trucking
American Trucking Associations' advanced seasonally adjusted (SA) For-Hire Truck Tonnage Index declined 3.2% in August after jumping 6.2% in July. In August, the index equaled 118.3 (2015=100) compared with 122.2 in July.
Said ATA Chief Economist Bob Costello:
The large swings continued in August, but the good news is the trend line is still up. While there is concern over economic growth, truck tonnage shows that it is unlikely that the economy is slipping into a recession. It is important to note that ATA's tonnage data is dominated by contract freight, which is performing significantly better than the plunge in spot market freight this year.
ATA Truck tonnage this month
(Click on image to enlarge)

Compared with August 2018, the SA index increased by 4.1%. The index is up 4.3% year-to-date compared with the same period last year.
source: ATA
CASS FREIGHT INDEX REPORT
The following was reported by CASS:
- Dropping Another -3.0% in August, Negative Volume Nine Months in a Row
- More Signs of Contraction - When Will the GDP Turn Negative?
- With the -3.0% drop in August, following the -5.9% drop in July, -5.3% drop in June, and the -6.0% drop in May, we repeat our message from last three months: the shipments index has gone from "warning of a potential slowdown" to "signaling an economic contraction."
(Click on image to enlarge)
Beyond our concern that the Cass Freight Shipments Index is negative on a YoY basis for the eighth month in a row:
- We are concerned about the increasingly severe declines in international airfreight volumes (especially in Asia) and the ongoing swoon in railroad volumes, especially in auto and building materials;
- We see the weakness in spot market pricing for transportation services, especially in trucking, as consistent with and a confirmation of the negative trend in the Cass Shipments Index;
- As volumes of chemical shipments have lost momentum, our concerns of the global slowdown spreading to the U.S. and the trade dispute reaching a 'point of no return' from an economic perspective grow.
Bottom line, more and more data is indicating that this is the beginning of an economic contraction. If a contraction occurs, then the Cass Shipments Index will have been one of the first early indicators once again.
(Click on image to enlarge)


Disclaimer: No content is to be construed as investment advise and all content is provided for informational purposes only.The reader is solely responsible for determining whether any investment, ...
more

