
Trading With Edge: Know Your Patterns
AAPL Trade
Last Thursday, (December 8th), we had a great trade in Apple (AAPL) after a well-defined bull flag formed following the morning push up. Looking at the 5-minute chart below you will see that AAPL shares popped from the open on solid volume before retracing to the VWAP, the white line, where prices held and consolidated before making another push up. I noticed prices were holding the $111.60 area as it tested it multiple times only to be bought back up so I waited for prices to break the descending resistance at the top range of the flag before I took my long position at $111.90 marked by the green arrow below. The trade never really went against me and I was able to capture about 40 cents of profit in a short amount of time, but was eventually stopped out on the last part of my position when we got two candles to close below the 20-day moving average at $112.10.

This was a text book bull flag/pennant setup that offered a high probability trade. I like taking these especially if I miss the initial move but still think it has more room to the upside. The only thing that could have made this trade better is if we would have had more volume come in when prices broke the upper resistance level. Volume eventually picked up but was not ideal. These are great patterns to look for so next time you see a stock ripping out of the gates, wait to see if a flag or pennant forms before another move up. I like to watch for these setups on the 5-minute chart with my entry chart being a 2 minute.
FB Trade
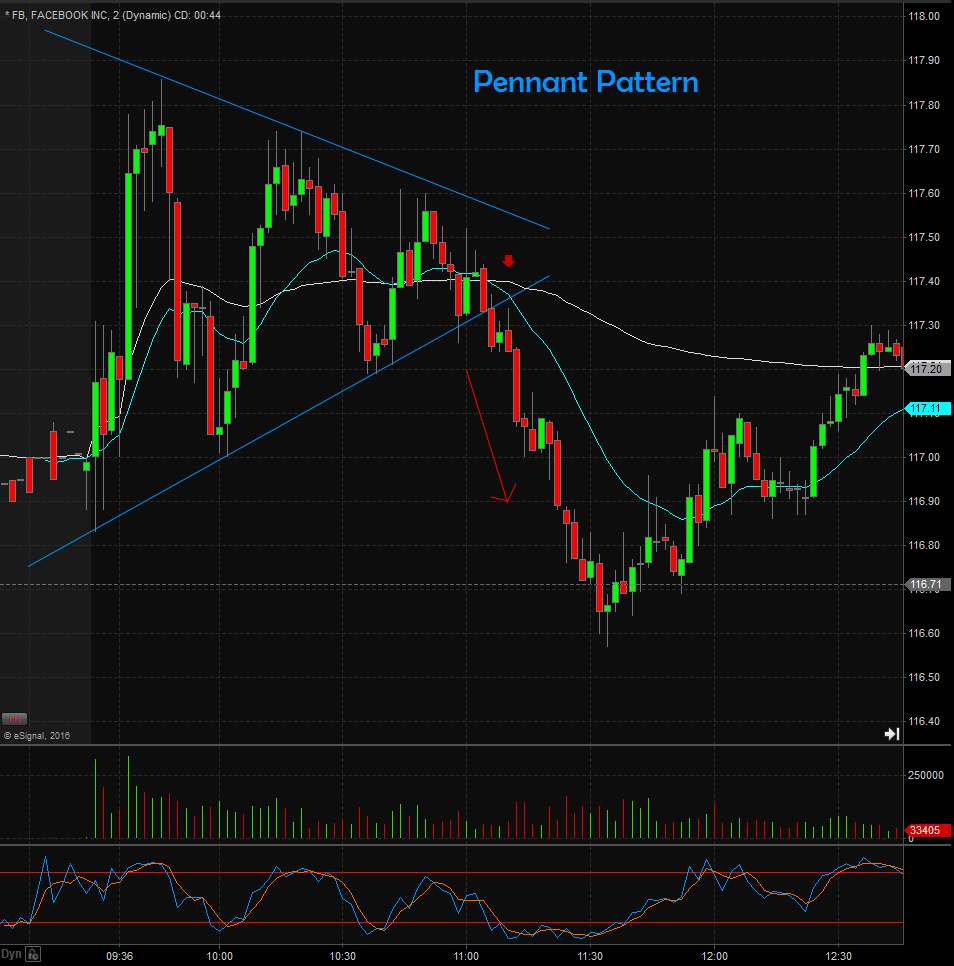
We had a nice pennant setup with Facebook (FB) last Wednesday (December 7th) that ended up working out great as well. You can see in the chart below that shares had a clear descending resistance level and a rising support level and when that happens you want to look for it to break that pattern, whether it be to the upside or downside. In this case, it broke lower and gave us a great opportunity to get short. I took it short at $117.30 and covered some through the flush of $117 with the rest being stopped out at $116.80. This is another example of why you need to know your patterns and just how powerful they can be. This was a low risk/high probability trade that was easy to identify and trade.
Disclosure: This is not a recommendation to buy or sell any stock but is merely an informative article on different trading setups.


thanks for sharing