

Fundamental Gold
The bull market in gold has awakened. The bull market began back in May 2019. We're in a position to finally take advantage of these prices we are getting. This has been a phenomenal run. This is not the end of this run, especially if you think of the current monetary policies, which call for unlimited stimulus to prevent an implosion of the global economy. The fundamentals have only become stronger as a safe-haven asset. We are building incredible equity during this current crisis.
For my first years in the business, I, like everyone else, focused on fundamentals. But I learned that fundamentals usually lag the market - buy the rumor and sell the fact. I then turned to AI.
The VC PMI AI For Gold
We are coming back up again to challenge the supply that we are going to identify. The market is identifying the kind of buying strength that can absorb the selling pressure at the Sell 1 level. The Variable Changing Price Momentum Indicator (VC PMI) helps us analyze the market and provide the Sell 1 and 2 levels.
(Click on image to enlarge)
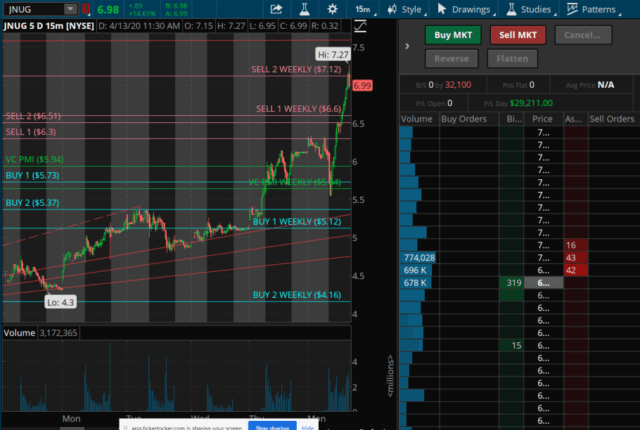
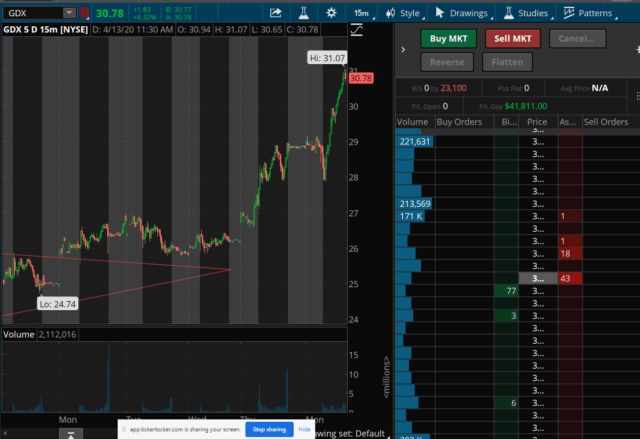
I'm trading the indices, the GDX, JNUG, and NUGT, which are going to be split at about 25 to 1 on the 22nd of this month, I believe. I'm trading them on the long side to build a position. I think the prices long term are going to go much higher. I want to take advantage of these short-term opportunities, but that doesn’t change my long-term view that I want to be long.
(Click on image to enlarge)
Courtesy: TDAmeritrade
For the daily, the Sell 2 level is $1801. This matches basically the annual numbers we published back on Sept. 28, 2019, of $1803. We completed the monthly target of $1719, which we published at the start of April. The high thus far was $1737. We are beginning to enter an area of long-term resistance or supply between $1719, the monthly Sell 1 level, and the annual level at $1803. The Sell 2 monthly level points up to $1841.
Understanding where the extreme levels of supply and demand exist allows me to manage my positions. It allows me to lock in the equity highs of a move. It allows us to buy this market in the blue when the VC PMI is identifying buying opportunities whether on the daily, weekly or monthly data.
Monthly and Annual Data
(Click on image to enlarge)
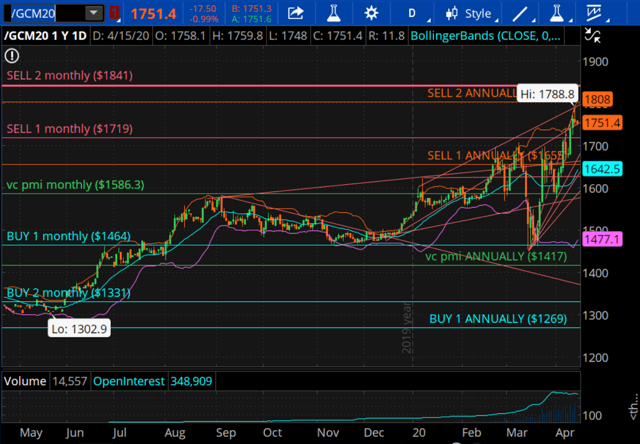
For the monthly chart, on May 31, 2019, it was the beginning of the bull market in gold. It activated a buy signal on the monthly at about $1331. The entry point was at $1335.60, which gave you a $4.50 risk. It identified the monthly target at $1464. From $1331 to $1464 is a huge move in gold. That's an over $120 move, easily, from May 31, 2019, to June 25, 2019. This was the initial breakout above the $1400 handle. It met the annual average price, trading above the average price until it activated again on Aug. 2 another buy signal above the monthly average price of $1464. It also activated a monthly bullish trend momentum.
Now we are putting the annual $1803 area into play as a target. For us, this has been an amazing move from that $1331 level. It is almost a $500 move since May 2019.
Silver
(Click on image to enlarge)
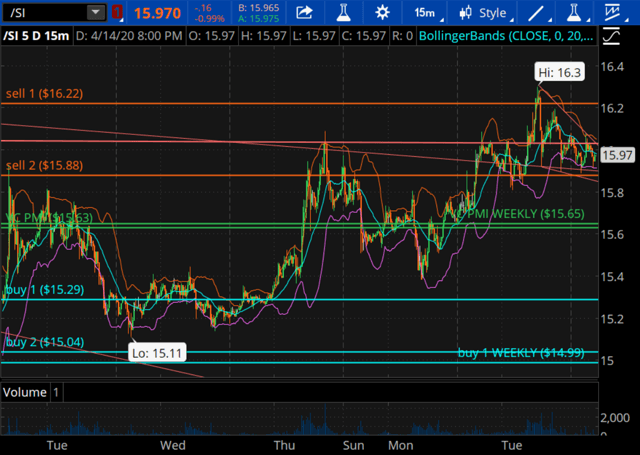
The pattern in silver seems very similar to gold, as does the stock market. We are looking at a head-and-shoulders bottom with a breakout from the right shoulder and moving into the weekly targets of $16.89 to $17.55. When the market breaks above the daily targets of $16.22 to $15.88, it automatically connects the algorithm to the weekly targets. That's where we are with silver, activating a buy signal on the weekly on a close above $13.75. The target above was completed daily and weekly. It also activated another buy trigger from that $15.04 level, which was the harmonic level between the daily and weekly. This is a powerful relationship with a high probability of a move up.
We seem to be blowing off in silver and gold. We got all the way up to $17.92, where we found some resistance. You can see the blow-off in gold, too.
E-mini
(Click on image to enlarge)
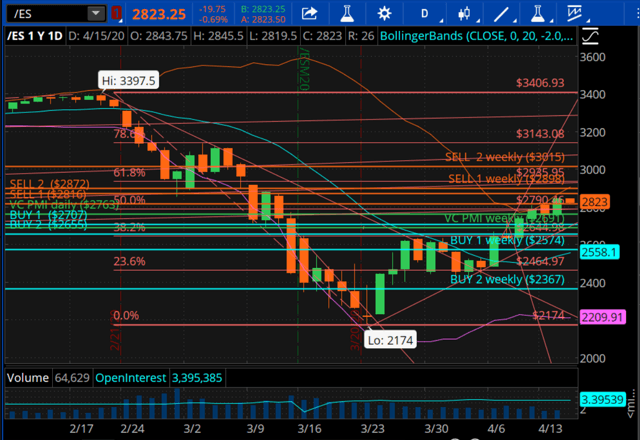
The E-mini S&P is an example of buy the rumor and sell the fact. The high was made back on Feb. 20, 2020. Stocks at that point appeared to have disregarded the coronavirus news that was coming out. China had suppressed the news for a few months, but the news began to come out. Rumors began to circulate, which led to panic selling in March. Rumors were that about 2.2 million Americans would die. By March 23, at the peak of panic and pessimism, the DJIA was down a few thousands of points in days, the market made a low of 2174. This was the weekend that the stock market became virtual for the first time. President Trump met with some of the biggest hedge fund managers and Fortune 500 airline executives. That Monday the market reverted and that was the bottom of the market. In retrospect, looking at this price action, the stock market anticipated the worst-case scenario. It was already factored in for the economic chaos that COVID-19 would trigger. The smart money bought aggressively at the bottom during the biggest fire sale since 1987. Now we are back up to 2824. We have almost gone 600 plus points since March 23. That's an incredible recovery. The E-mini market is saying it already has discounted the worst-case scenario because the government had stated it will supply unlimited amounts of stimulus, which is bullish for the stock market.
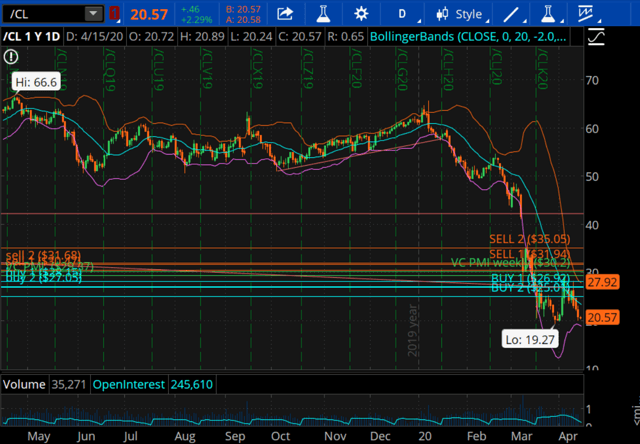
The system is basically broken right now and the only way to provide stability is to provide whatever amount of liquidity required to keep the system operating. If the government does not do it, then demand could evaporate. Crude oil is an example - down to $21.54. The market is crying out for some form of relief. Oil fell from $63 down $23, which devastated many highly leveraged companies. We are now waiting for various assets to find their true value.
(Click on image to enlarge)
Gold: Paper Vs. Physical
Gold mining companies have basically shut down production. Exchanges cannot get physical gold to fulfill paper contracts on the London bullion market. The price was manipulated by predatory short selling in the paper market since 2013. Short sellers pulled billions of dollars out of the market and prevented the market from determining the true value of gold.
Now gold and silver are offering a way for you to hedge against what could be devastating for the US dollar and the global economy. The inflationary risks inherent in the current fiscal policy of printing money mean that we could see hyperinflation and gold rising in value significantly.
Once the economy starts to normalize, the danger is the velocity of money. How fast are people going to be chasing goods, which may not be readily available, like gold. You can’t buy gold right now without paying a serious premium. Will that affect food, which is being dumped today? Restaurants have closed, so food supply and demand is distorted. Crude oil demand has plummeted. The markets are still trying to find their footing in identifying the real value of various goods.
We’re looking at gold at $1786, almost approaching the annual target of $1803. Silver is up 72.80, also in an area where the VC PMI is recommending that you lighten up your positions if you are long silver. We are looking for a reversion in gold from here. The price has to come down to close below $1781, which would activate another short trigger.
NUGT
(Click on image to enlarge)
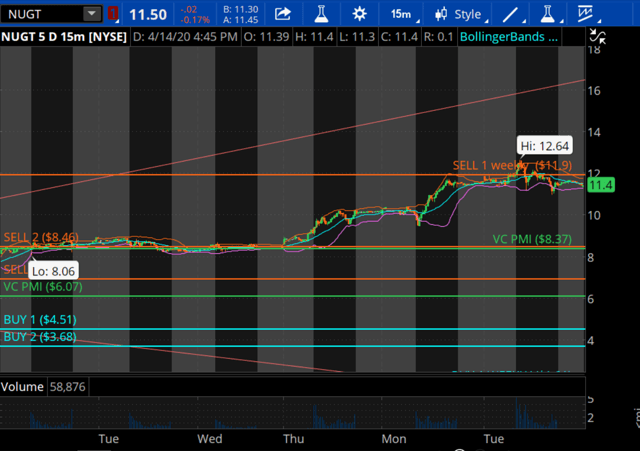
We are carrying on a buy and hold basis NUGT. The market also is trading above the Sell 1 level. It reached $12.64. We recommend that when the price is in this area up here, that you lighten up and book the profits. The VC PMI tells us that we are going to start to see some sellers come into the market up here. Now we are waiting to see what the price does.
JNUG
(Click on image to enlarge)
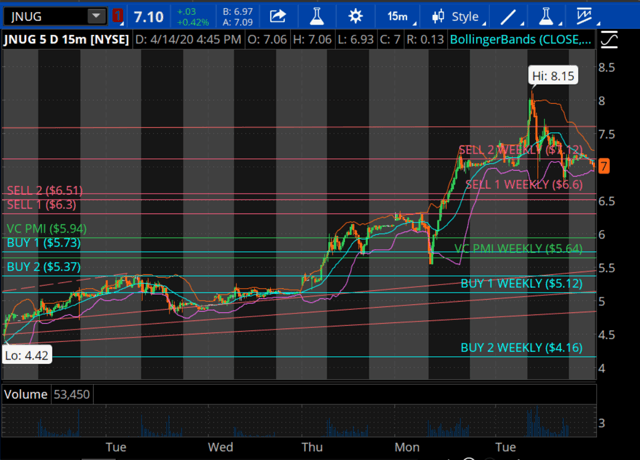
JNUG is trading at 7.78, way above the daily numbers and into the weekly numbers with a high of 8.15. We are looking for a close under 7.12 in order to activate a short trigger on JNUG.
GDX / LEAPs
(Click on image to enlarge)
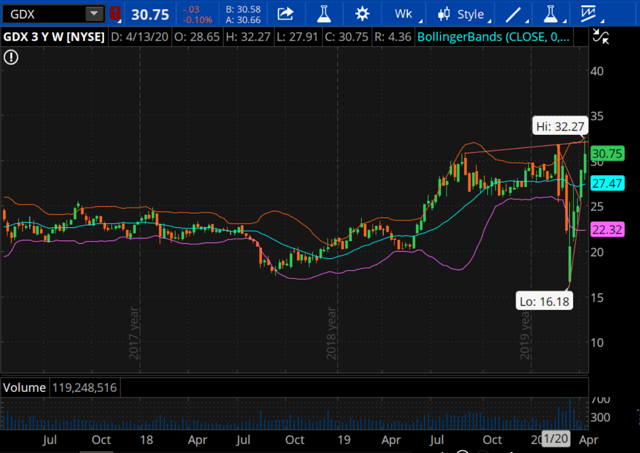
GDX is the gold mining share trust. It has had a phenomenal move from about 25.54 to 32. Besides buying GDX itself, we have taken a position on buying LEAPs. A LEAP is an option that gives you more than a year’s time. We have purchased about 100 of the Jan. 21, 2028, LEAP calls. We bought it for about a $400 premium. It is trading in the $800 levels already, so we have more than $90,000 profit. That helps us come back after we took a hit in our portfolio right after the crash of March 23.


Comments
Log in or sign up to join the conversation.