

Bitcoin chart analysis
The price of Bitcoin managed to reach a new weekly high on Tuesday at the $67922 level. After its formation, we saw a pullback to support at the $65,000 level. The price managed to stabilize at that level and initiate a new bullish consolidation. This morning, we are back above $ 67,000 again, forming a daily high of $67550. At that level, Bitcoin encounters resistance and makes a new pullback to the $67,000 level.
A slight bearish pressure is present on the chart, which could negatively affect this week’s trend. Based on that, we expect a pullback to the $66,000 support level. This is where the EMA 50 moving average joins us, and we hope for its support. If that is not enough, the price will have to make a breakthrough below. Potential lower targets are the $65,000 and $64,000 levels.
(Click on image to enlarge)
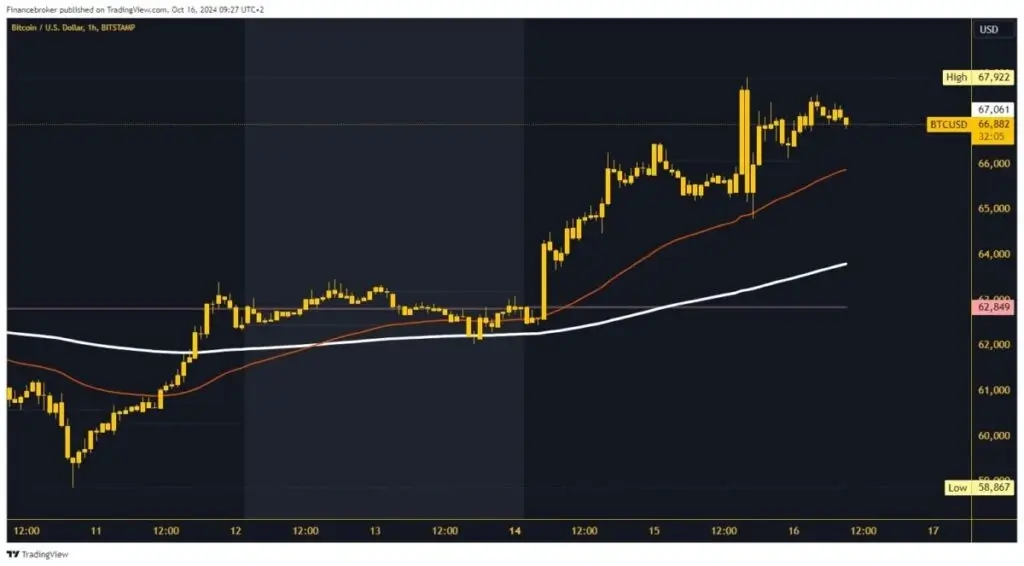
The price remains on the bullish side on Wednesday, testing the $67,000 level
At $64000, Bitcoin will try to regain the support of the EMA 200 moving average and remain on the positive side. If the price fails, it will continue down to the $63000 weekly open level. For a bullish option, we expect to hold above $67000 and prepare for a continuation to the bullish side. We can start a bullish consolidation after returning above the daily open level.
The first target is this week’s high at $67922. With a new impulse, Bitcoin climbs to a new October high and thus confirms the continuation of the previous bullish trend. Potential higher targets are the $68,000 and $69,000 levels.
More By This Author:
Nvidia Nears All-Time High After Shaving Off 30%. Will It Continue Rallying?Bitcoin And Ethereum: Bitcoin Drops To New Low On Thursday
Amazon Stock Outlook: Resistance at $186; Eyes $20B+ Savings



Comments
Log in or sign up to join the conversation.