Three Patterns In World Trade Since The Pandemic

The World Trade Organization has released its World Trade Statistical Review 2022, which includes an overview of world trade patterns in 2021 and the first half of 2022. In the big picture sense, it’s no surprise that global trade slumped hard in the pandemic year of 2020 and the rebounded briskly in early 2021. Here, I wanted to pass along three of the figures from later in the report that had something interesting to say about shifts in the underlying patterns of world trade.
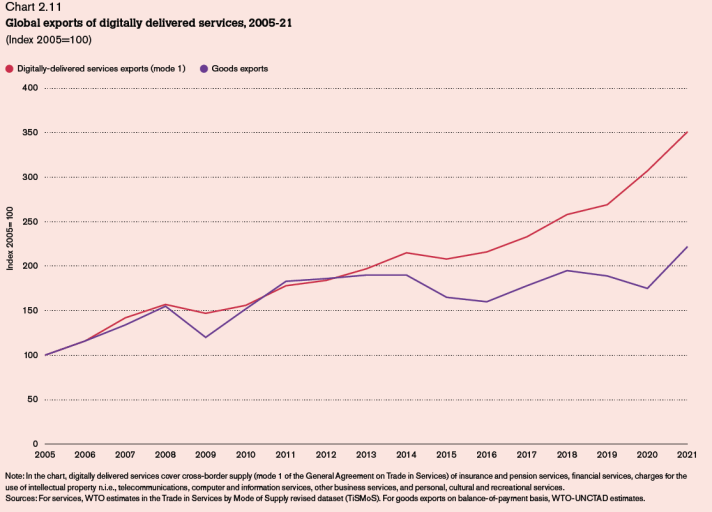
This first figure shows trade in “digitally delivered services (mode 1),” which refers to cross-border trade involving “insurance and pension services, financial services, charges for the use of intellectual property n.i.e., telecommunications, computer and information services, other business services, and personal, cultural and recreational services. Notice that from 2005 up through about 2012, growth in digitally delivered trade was increasing at about the same rate as trade in goods. But since then, trade in goods has increased only modestly, while trade in digitally-delivered services has nearly doubled. The gap seems to have widened in 2021, as the first force of the pandemic eased.

Just to be clear, this graph does not show the levels of trade in digitally-delivered services and in goods. The level for each category is set at a index number of 100 for the year 2005. The graph only lets you compare rates of growth since then. For a perspective on levels, global exports of digitally-delivered services was $3.7 trillion in 2021, while merchandise trade was roughly six times as large at $21.7 trillion. But the trendlines strongly suggest that digitally-delivered services will be a growth area for international trade in the future, while trade in goods may not be.
A second figure shows the quantity of container shipping from January 2015 through August 2022. The drop in can container shipping around April 2020 captures one aspect of the supply chain shocks that were happening at that time. Measured by the adjusted (orange) line, the quantity of containers shipped has reached an all-time high. But as the WTO notes: “Shipping indices showed global container throughput at an all-time high in September 2022 but not much higher than in 2021, suggesting weak trade growth in 2022.”

Finally, the third figure shows the number of international commercial flights from January 2020 through August 2022. You can see the 80% fall in such flights in the pandemic, and the gradual recovery since then. The WTO describes the patterns this way: “International commercial flights are classified as transport services and are closely associated with travel expenditure by international tourists. Both cargo and passenger flights also carry significant quantities of goods, so they are linked to both merchandise and commercial services trade. Daily commercial flights, including flights within the European Union, finally exceeded their level at the start of 2020 during the summer of 2022. However, flights excluding those within the EU remained below their prepandemic level in August 2022. Rising fuel costs and increased economic uncertainty are expected to weigh on commercial flights in the remaining months of 2022 and in 2023.”

More By This Author:
When Lower-Income Countries Face Rising Global Interest Rates
An Economist Chews Over Thanksgiving
Some Economics Of Dominant Superstar Firms
Disclosure: None.


