
Stocks Are Still Expensive And Momentum Is Negative: Be Careful Out There
Successful investing does not need to be too complex or sophisticated. At the end of the day, it all comes down to relying on time-proven return drivers to make investment decisions based on solid statistical evidence as opposed to emotions and speculation.
We can basically analyze the market environment based on two main factors: valuation and momentum. Ideally, you want to have both factors on your side, meaning that you want to buy aggressively when stocks are cheap and momentum is favorable. On the other hand, when valuations are expensive and momentum is negative, this tends to produce disappointing performance in terms of returns and downside risk over the long term.
Unfortunately, the big picture for U.S. stocks in terms of both valuation and momentum together does not look pretty at all.
The Two Main Drivers To Consider
Valuation matters in the long term. Price is what you pay, and value is what you get. You want to get as much value as possible when you purchase stocks, because the valuation you are paying can have a considerable impact on subsequent returns.
The CAPE ratio is a commonly used valuation metric for stock markets, and the data shows that it can have a huge impact on returns. The table below is from a research paper entitled Global Value: Building Trading Models With The 10 Year CAPE. The data shows how the starting CAPE ratio impacted returns over different time periods in 32 countries from 1980 to 2011.
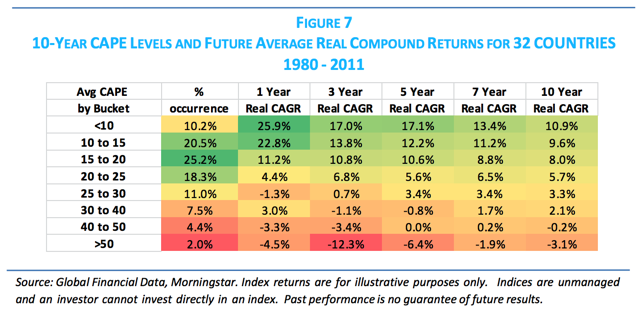
Global Value: Building Trading Models With The 10 Year CAPE
Sometimes, valuation does not work as expected. An expensive market can always get more expensive when risk appetite continues increasing over time. Besides, there is always the possibility that the economic fundamentals and corporate earnings will outperform expectations. In other words, markets and stocks can grow rapidly enough to justify an expensive valuation.
Also, buying cheap stocks does not guarantee future returns. When the fundamentals are deteriorating in a permanent way, even buying at a relatively low valuation can turn out being an expensive mistake.
But even if valuation is no perfect predictor of future returns, the data is quite clear: all else the same, the lower the valuation, the higher the returns you can expect going forward. This is particularly true over long periods of time.
In addition to valuation, you also want to consider the main trends in asset prices when making investment decisions. Momentum is a persistent force, meaning that markets that are outperforming tend to continue outperforming over the middle term and vice versa.
Importantly, considering both valuation and momentum together can make a massive difference in performance. The table from Econompic data shows how U.S stocks have performed based on different combinations of CAPE ratio and momentum levels.
The lower the valuation the higher the returns, and positive momentum beats negative momentum at all valuation levels. Investing at the lowest valuation levels with positive momentum produces an annualized return of 17.76%, and investing at the highest valuation levels with negative momentum produces a negative annualized performance of -16.02%.
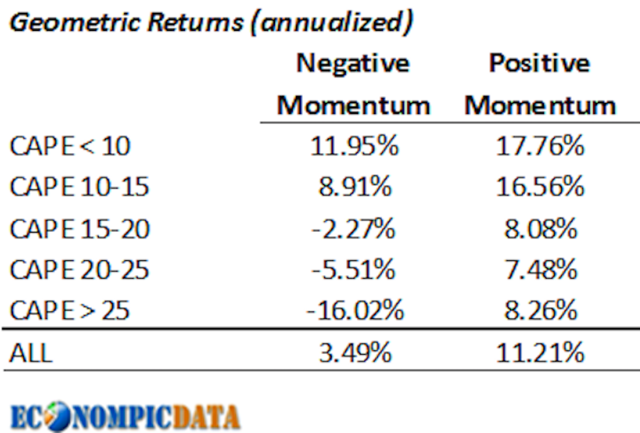
Source: Econompic data
The Big Picture Looks Ugly
Even after a substantial pullback in recent months, the U.S. stock market remains quite expensive, with the CAPE ratio in the neighborhood of 27.8 according to data from multipl.
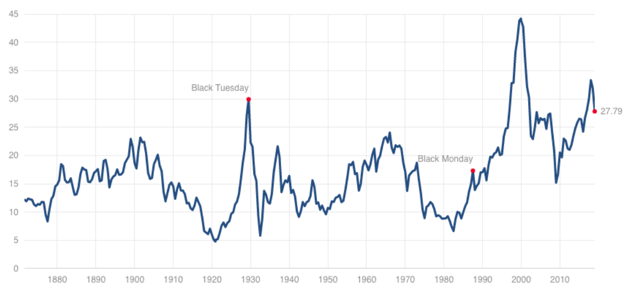
Source: multipl
It's not about the CAPE ratio alone, all kinds of valuation indicators are currently indicating that stocks in the U.S. are priced at aggressive levels.
The chart from dshort shows the evolution of multiple metrics such as the Crestmont PE, the Cyclical PE, the Q Ratio, and the deviation of the S&P 500 index from its linear regression. Looking at the average of these four indicators, it's hard to argue against the fact that stocks remain relatively expensive.
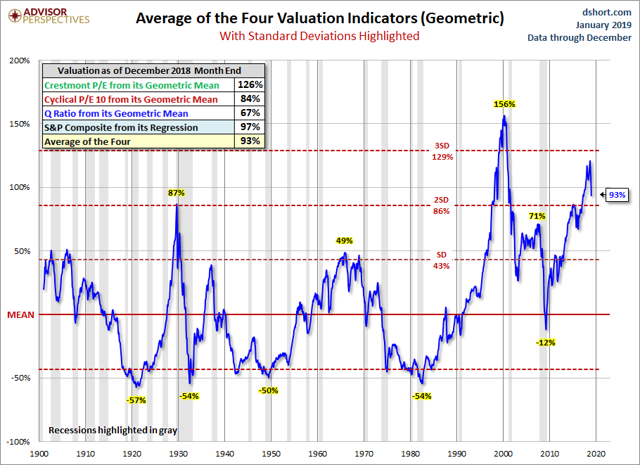
Source: dshort
U.S. stocks have been expensive for several years now, and this has not stopped them from producing attractive returns in years such as 2017. But there is a key difference to consider: momentum was positive in 2017, and it is clearly negative side as we enter 2019.
The Global Rotation System is a rules-based investing system based on momentum. The system basically picks the 3 ETFs with the strongest risk-adjusted momentum metrics over 3 and 6 months from a universe of more than 30 ETFs representing different asset classes, sectors, industries, and regions of the world.
Since the model is based on momentum, it buys risky assets when risk appetite is strong, and these kinds of assets are outperforming. Conversely, the model gravitates towards low-risk assets when risk appetite is declining in the market.
Backtested performance for the Global Rotation System has been outstanding in the long term when considering both risk and returns. In annual terms, the Global Rotation System gained 16.6% per year versus 7% per year for the SPDR S&P 500 (SPY) since 2007.
Such as important, the maximum drawdown is less than half: 18.4% for the quantitative system versus 55.2% for the SPDR S&P 500 in the same period. Note: Drawdown is measured as the greatest percentage drop from the high, based on daily closing prices.
In cumulative terms, the Global Rotation System gained 527.1% versus 127.5% for the SPDR S&P 500 over the backtesting period.
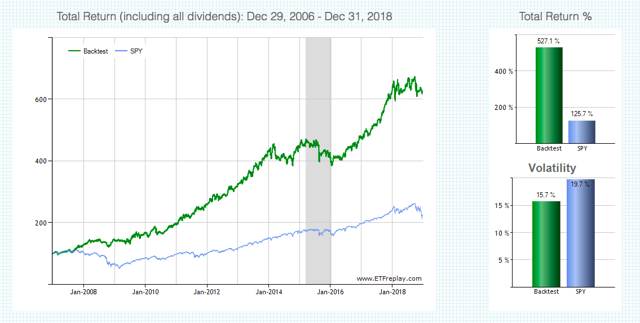
Source: ETFreplay
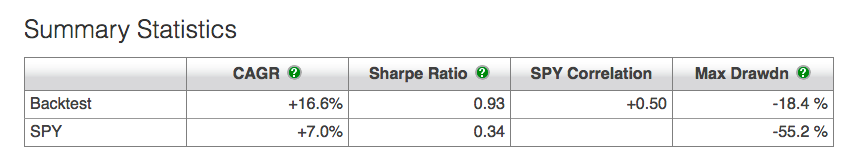
Source: ETFreplay
The system can't be expected to outperform in every year. It should, in fact, be expected to underperform the index when the main momentum indicators are unstable. When markets are moving sideways and momentum indicators are changing a lot in the short term, a quantitative system such as this one will probably provide lots of false signals and ultimately below-average returns.
In other words, the Global Rotation System does not work every time, but it works well over the long term, and it is very effective at providing capital protection during a bear market.
This system is updated monthly in real time for members in my research service, The Data-Driven Investor. As of January, the portfolio will be allocated to Gold (GLD), Short Term Treasuries (SHY), and Long-Term Treasuries (TLT) ETFs.
These three asset classes are clearly safe heavens, and the portfolio positioning is indicating that momentum looks quite ugly for all kinds of stock indexes.
Going back to the table from Econompic data, the current CAPE ratio for U.S stocks is currently above 25, and momentum is clearly negative. This puts us in the worse possible environment, meaning that stocks are expensive and moving in the wrong direction.
Source: Econompicdata
Until we see an improvement in valuation or momentum, ideally in both, the statistical evidence is indicating that investors should play it safe in the current market environment.
Disclosure: I am are long SDS.
Disclaimer: I wrote this article myself, and it expresses my own opinions. I am not receiving compensation for it. I have no business relationship with ...
more

