$XLY Forecasting The Decline And Selling The Rallies At Blue Box
Hello Everyone! In this technical blog, we are going to take a look at the Elliott Wave path in Consumer Discretionary ETF ($XLY). We keep telling members that $XLY is showing an incomplete bearish sequence in the higher timeframes and any rallies can be sold in 3 or 7 swings at blue boxes for more downside.
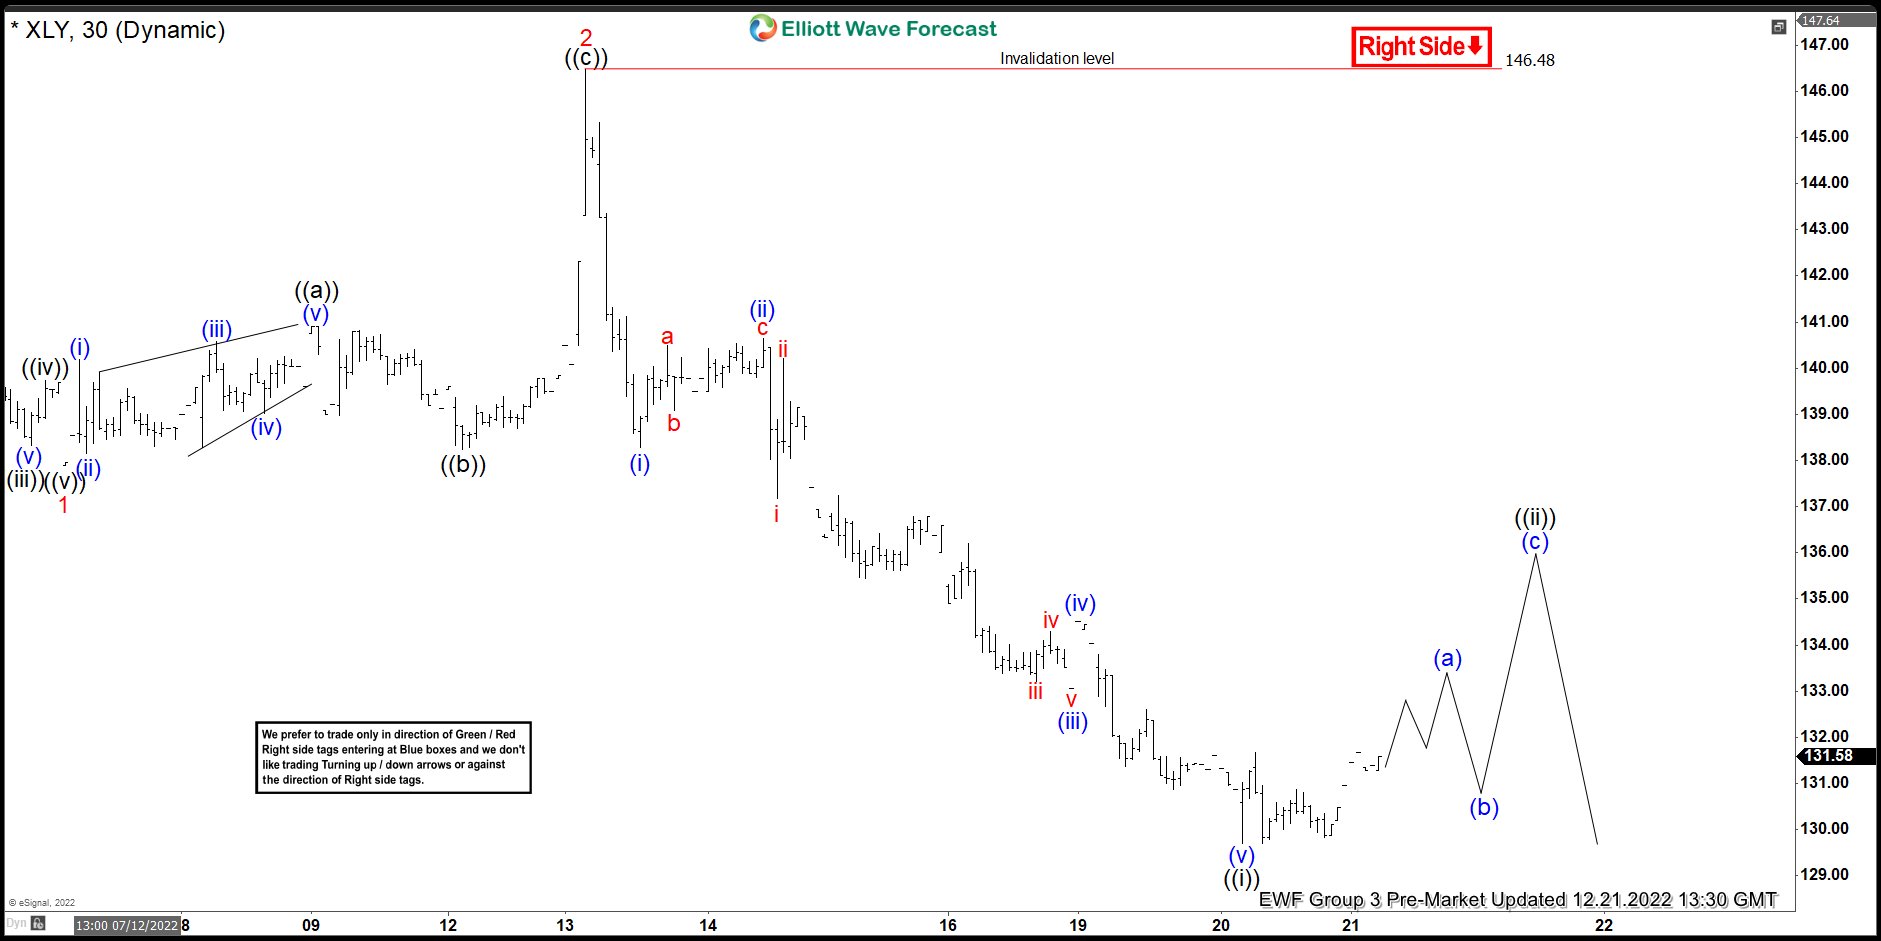
$XLY 1H Elliott Wave Analysis Dec 21 2022:
(Click on image to enlarge)
The ETF has made 5 waves from 12.13.2022 peak at $146.48 and ended the cycle. We advised members to sell the bounce in 3 or 7 swings at black ((ii)) targeting more downside.
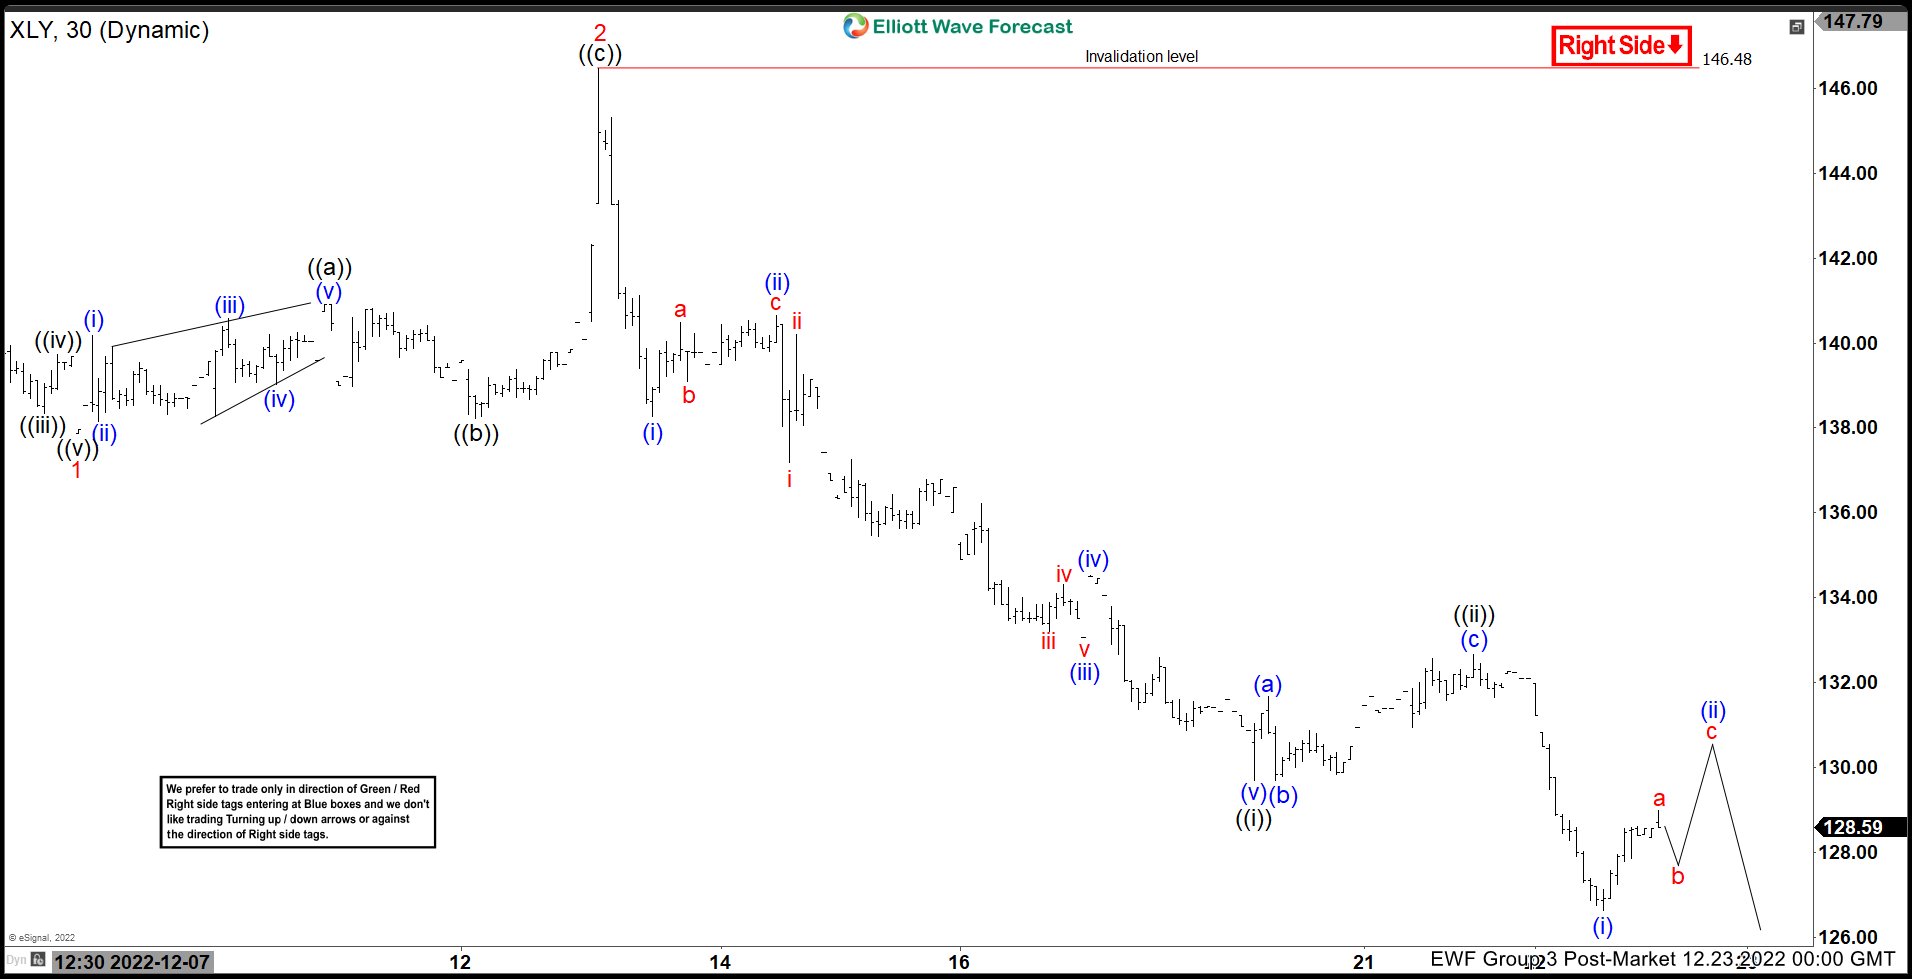
$XLY 1H Elliott Wave Analysis Dec 23 2022:
(Click on image to enlarge)
The ETF’s bounce failed in 3 waves and made a new low below ((i)) as expected. Any sellers are now risk free and should continue to hold for more downside. Right now, we keep pushing it lower in 3 or 7 swings at blue box areas against black ((ii)) connector. As our members know, Blue Boxes are no enemy areas , giving us 85% chance to get a reaction.
Elliott Wave Forecast
We cover 78 instruments in total, but not every chart is a trading recommendation. We present Official Trading Recommendations in the Live Trading Room. If not a member yet, Sign Up for Free 14 days Trial now and get access to new trading opportunities. Through time we have developed a very respectable trading strategy which defines Entry, Stop Loss and Take Profit levels with high accuracy.
Welcome to Elliott Wave Forecast!
More By This Author:
HCA : Should It Be Ready For Next Rally ?Pan American Silver (PAAS) Bottom Can be In Place
Oil Extending Lower In Wave 5
Disclaimer: Futures, options, stocks, ETFs and over the counter foreign exchange products may involve substantial risk and may not be suitable for all investors. Leverage can work against you as ...
more


