
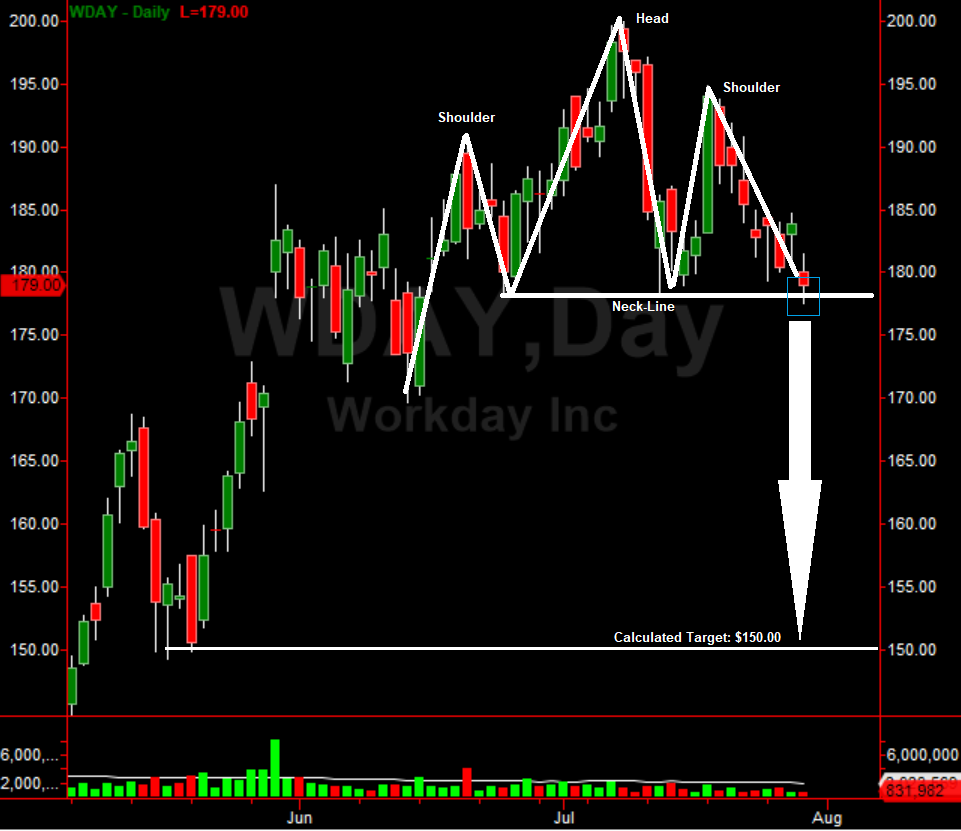
Workday Stock Chart Pattern: Head & Shoulder
Workday Inc (WDAY) is slightly lower on the day as the markets chop ahead of major earnings from Amazon (AMZN), Alphabet (GOOGL), Apple (AAPL) and Facebook (FB). Based on the pure technical chart, the workday stock chart pattern is poor. There is a classic head and shoulder stock chart pattern that is borderline triggering. The neckline is at $178.25. Any daily close on Workday below $178.25 triggers the bearish pattern. A calculated target for Workday is $150.00. This sets up perfectly with a key support level at $150.00. Watch for the trigger and expect further downside. The Workday stock chart pattern is bearish but has not triggered yet. Look for it to trigger within a day or two.
(Click on image to enlarge)
Disclosure: None.
How did you like this article? Let us know so we can better customize your reading experience.

Comments
Leave a comment to automatically be entered into
our contest to win a free Echo Show.

