
The major stock market indices have spent much of the first half of 2022 engulfed in a bear market that has eaten away any investor gains experienced last year.
Stock market bulls are anxious that a trading low is forming but recent volatility has clouded short-term forecasts.
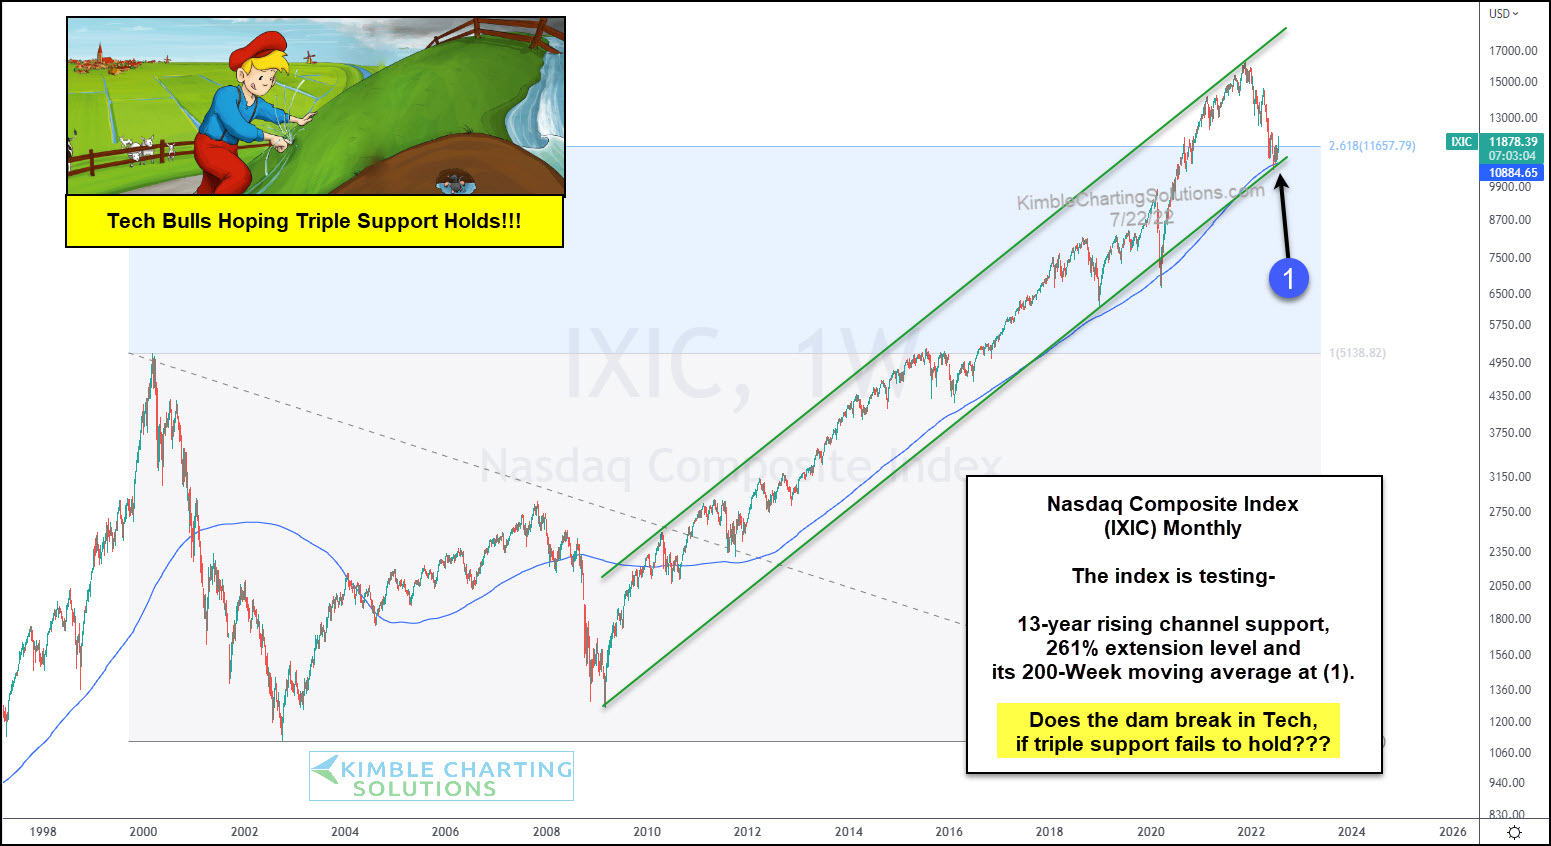
So today we step back a bit to look at a long-term “monthly” chart of a major U.S. stock market index: The Nasdaq Composite.
As you can see, the recent decline has been sharp. And it has taken price from the top of the rising channel the bottom of the channel.
This appears to be an important support area at (1), a confluence of channel support, the 200-week moving average, and the 261% Fibonacci extension level.
Will the dam break for tech stocks? Or will triple support hold strong?
(Click on image to enlarge)
More By This Author:
Important Commodity Ratio Points To Lower Interest RatesNYSE Index Bounces Off 38.2 Fibonacci Level, Will It Hold?
Energy Stocks Attempting To Break Down Through Key Support


Comments
Log in or sign up to join the conversation.