
Why Tesla Stock Could Be Headed For Blue Sky Run If This Key Pattern Forms

Photo courtesy of Tesla
Tesla, Inc TSLA opened the trading session slightly lower on Wednesday in consolidation after soaring over 10% between Monday and Tuesday. The move higher was caused by the stock breaking up bullishly from an inside bar pattern, which Benzinga called out on March 25.
A longer period of consolidation would be healthy for Tesla, which has soared 47% between March 15 and Tuesday to reach a high of $1,114.77.
Cathie Wood-led Ark Investment Management took advantage of Tesla’s massive rebound to lock in some profit on Tuesday. The firm sold 52,335 shares, estimated to be worth approximately $57.54 million, although the Elon Musk-led EV company remains one of the investment firm’s top holdings.
Although news of Wood’s firm selling some of its position may have initially weighed on the stock, Tesla looks set to fly higher still because it’s printing another inside bar pattern on the daily chart.
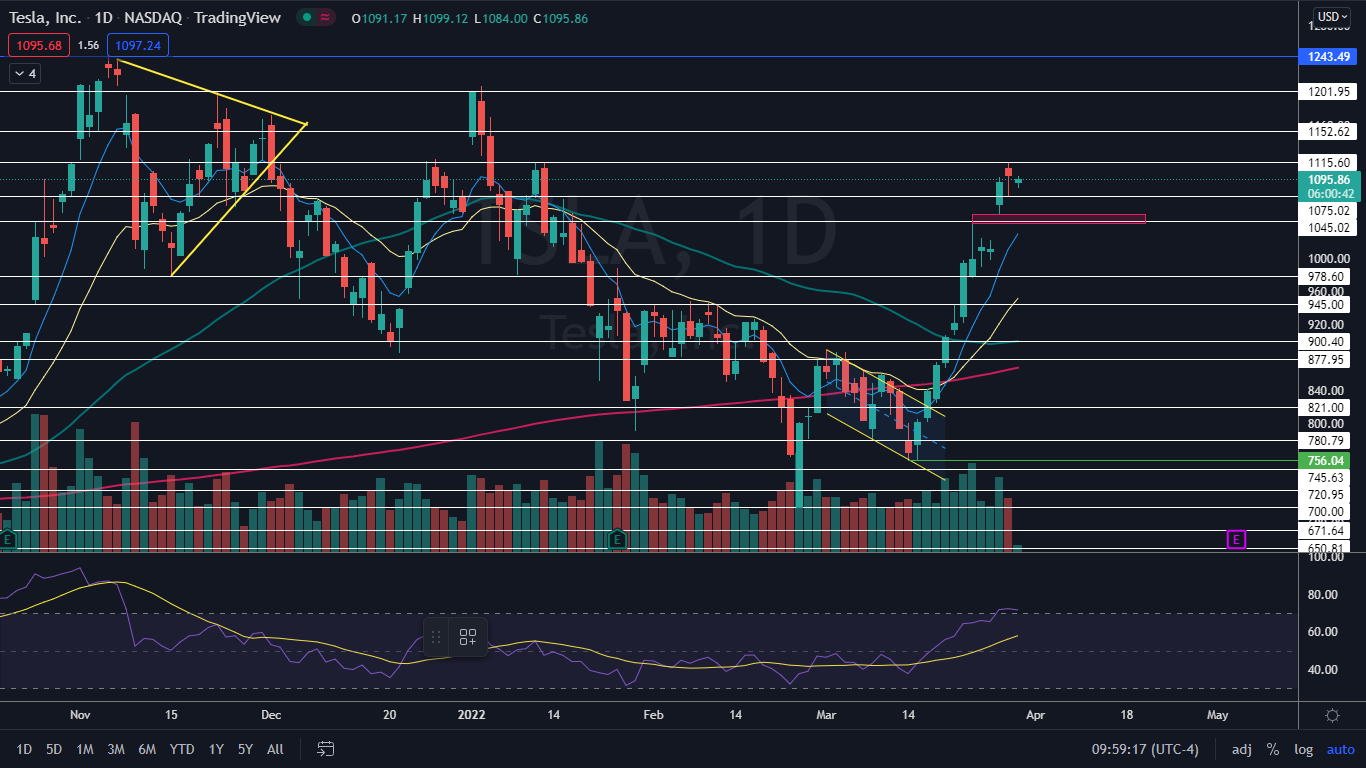
The Tesla Chart: On Wednesday, Tesla’s price action was taking place completely within Tuesday’s trading range, which has set the stock up into an inside bar pattern. The inside bar leans bullish because Tesla was trading higher before forming the pattern. Traders and investors can watch for a break up or down from Tuesday’s mother bar later on Wednesday or on Tuesday to gauge future direction.
If Tesla breaks bullishly from the pattern, the stock is still in need of retracement at some point because Tesla hasn‘t printed a higher low to confirm an uptrend on the daily chart since reversing north mid-month. When the pullback comes, bullish traders and investors can watch for a reversal candlestick, such as a doji or hammer candlestick, to form in order to enter into a position.
If Tesla trades sideways or pulls back slightly over the coming days it could settle into a bull flag pattern. If a bull flag is formed as part of a consolidation pullback, the measured move would be 47%, which indicates Tesla could trade up into blue skies above the $1,600 level in the future.
A pull back would also help to cool Tesla’s relative strength index (RSI), which is measuring in at about 73%. When a stock’s RSI reaches or exceeds the 70% level, it becomes overbought, which can be a sell signal for technical traders.
Tesla is trading above the eight-day and 21-day exponential moving averages (EMAs), with the eight-day EMA trending above the 21-day, both of which are bullish indicators. The stock is also trading above the 50-day and 200-day simple moving averages, which indicates longer term sentiment is bullish.
- Bulls want to see continued consolidation help to cool down the RSI and for a pull back to take place to confirm a daily uptrend, which would also help the eight-day EMA to catch up to the share price. Tesla has resistance above at $1,115.60 and $1,152.62.
- Bears want to watch for a volume climax to take place when bullish traders become exhausted and begin to take profits. Tesla has support below at $1,075.02 and $1,045.02.
(Click on image to enlarge)
© 2022 Benzinga.com. Benzinga does not provide investment advice. All rights reserved.


