Why Snap Stock Must Hold This Key Level To Avoid Free Fall

Photo: Thought Catalog via Unsplash
Snap Inc SNAP was trading mostly flat on Tuesday morning after opening slightly higher but being unable to bust up through Monday’s high-of-day. The social networking app company has been trading in a fairly consistent downtrend since suffering a bearish reaction to its third-quarter earnings beat.
On Monday, Chief Business Officer Jeremi Gorman sold a total of 51,425 shares for proceeds that totaled $2,286,615.87. When an insider sells off part or all of their position it can be a red flag for investors because it can signal the person doesn’t believe the stock will rise, although there can be a number of personal reasons an executive decides to sell their shares.
On Dec. 15, JP Morgan Chase & Co JPM maintained its Overweight rating on Snap and lowered its price target from $73 to $65.
If Snap could rebound up to the $65 mark it would be a gift to bullish investors because it would represent a 45% increase over the current share price. Although Snap has a lot of work to do before ever reaching that level, there are bullish signs on the chart that a reversal to the upside may be in the cards.
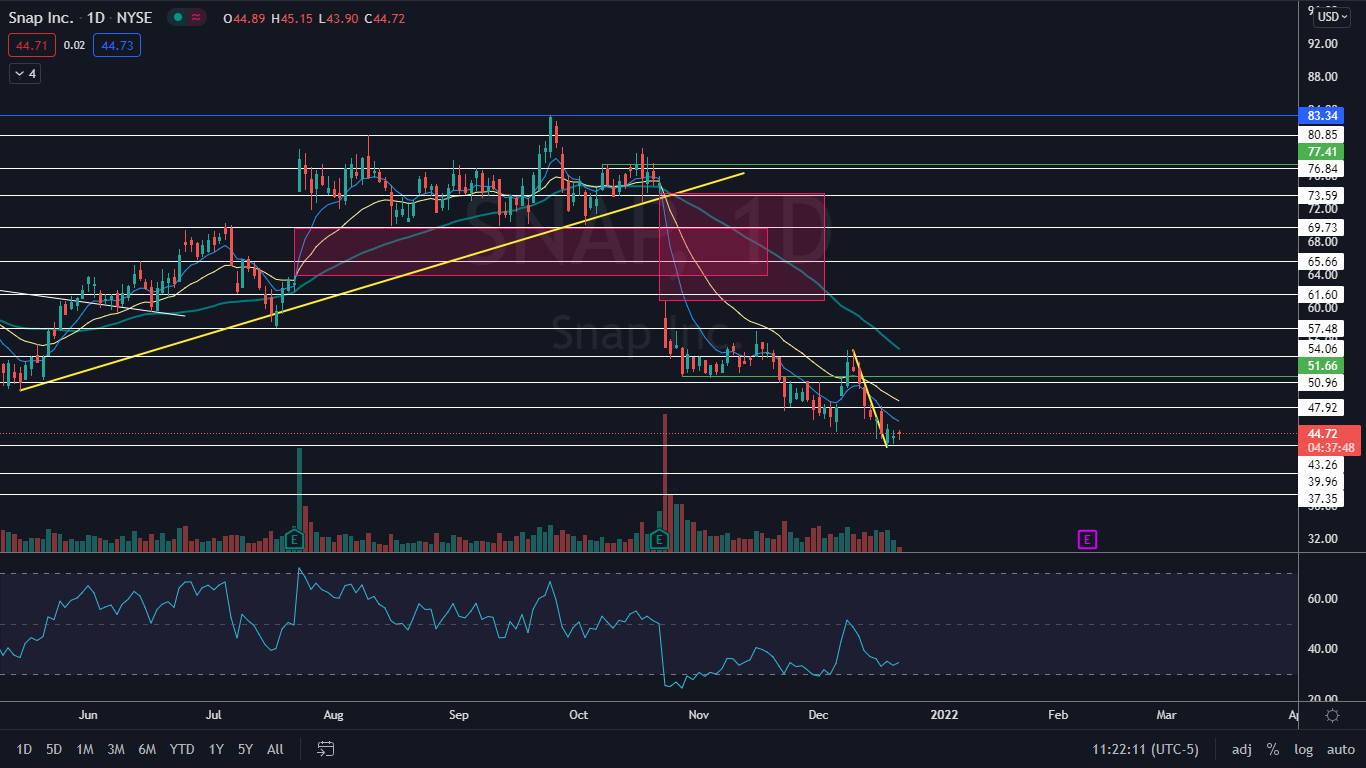
The Snap Chart: On Friday and Monday, Snap tested a support level near the $43.26 level and bounced, which created a bullish double bottom pattern on the daily chart. On Tuesday, the stock attempted to react to the pattern but the general markets were showing indecision with the SPDR S&P 500 ETF Trust SPY trading flat to its opening price.
Tuesday’s price action as of late morning had Snap printing an inside bar, which indicates a period of consolidation. The stock also had lower-than-average volume indicating there isn’t a high level of interest in the stock at the present time.
Bulls may feel cautious that Snap could be settling into a bear flag pattern, with the pole formed between Dec. 9 and Dec. 17 and the flags over the trading days that have followed. If Snap falls below its closest lower support level on higher-than-average volume on lower timeframes, traders can feel confident the pattern was recognized.
Snap is trading below the eight-day and 21-day exponential moving averages (EMAs) with the eight-day EMA trending below the 21-day, both of which are bearish indicators. The stock is also trading below the 50-day simple moving average, which indicates longer-term sentiment is bearish.
- Bulls want to see big bullish volume come in and break Snap up over Monday’s high-of-day price and for momentum to push the stock up over the eight-day EMA, which would negate the possible bear flag. Snap has resistance above at $47.92 and $50.96.
- Bears want to see big bearish volume come in and drop Snap down through the bottom of the flag formation. Below the area there is some support at $39.96 and $37.35, but if Snap were to fall below the levels, it could free-fall toward $30.
(Click on image to enlarge)

© 2021 Benzinga.com. Benzinga does not provide investment advice. All rights reserved.


