
Why Lucid Group Stock Looks Geared Up For A Gap Fill

Lucid Group Inc LCID was trending on r/WallStreetBets early Monday morning following a multi-day bullish price adjustment that caused the stock to rise over 100% from the Oct. 14 low of $22.51.
The long-stalled bipartisan $1.2-trillion infrastructure bill, which includes $7.5 billion in funding to create a nationwide network of electric vehicle charging stations, passed the House of Representatives Friday. President Joe Biden is expected to sign the package into law over the coming days.
The bill could help to further boost stocks in the EV sector, although for technical traders there are still levels and patterns likely to come into play.
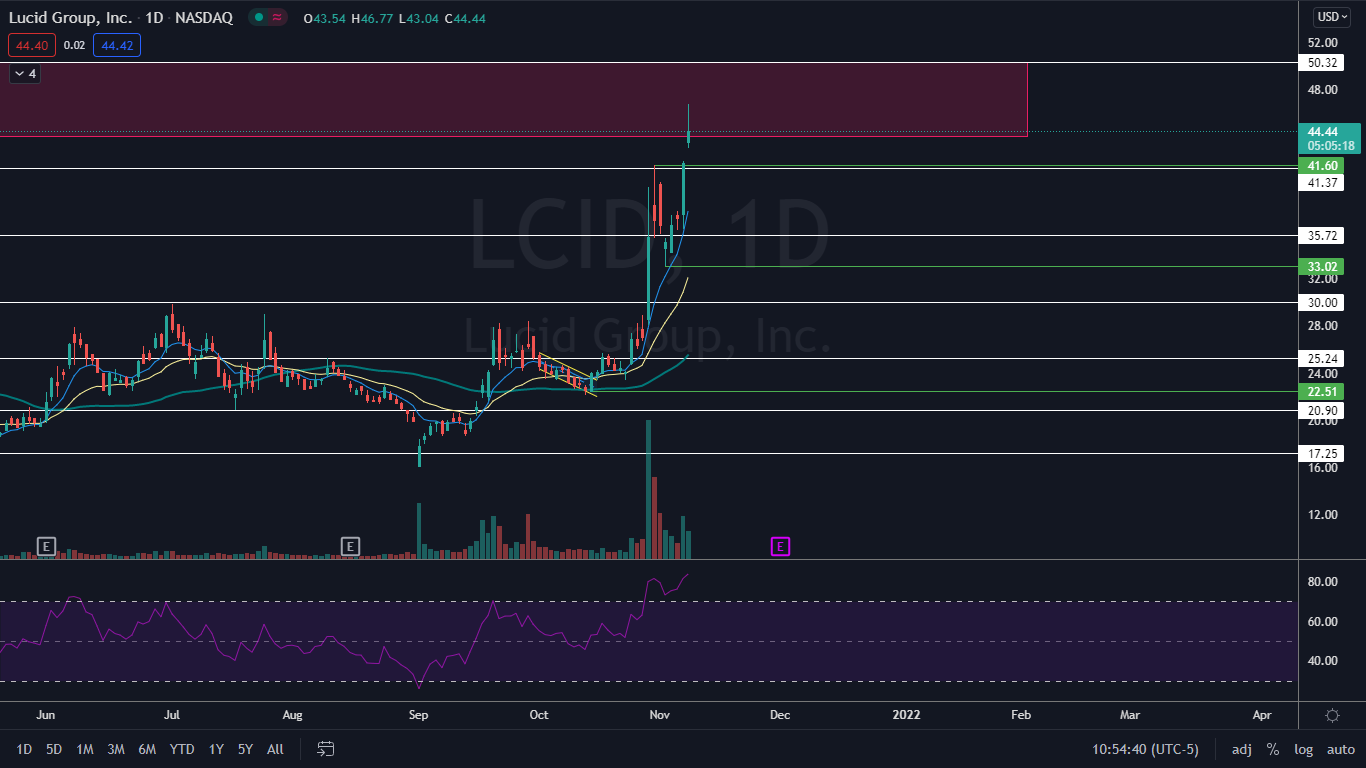
The Lucid Chart: Lucid gapped up about 4% higher on Monday morning after printing a big bullish engulfing candlestick on Friday, which indicated higher prices were likely to come. The stock then ran another 7.42% higher into a gap that was left behind on Feb. 23 between the $43.94 and $50.32 range but ran into sellers and profit takers just below the $47 level.
Technical traders may have seen the run coming when Lucid broke up from a falling channel on Oct. 14, which indicated a trend change may be in the cards. The stock then reached a high of $25.66 on Oct. 18 and created a higher low of $22.51 on Oct. 22, which indicated a new uptrend had begun.
Lucid had since created a consistent series of higher highs and higher lows on the daily chart, with the most previous higher low printed on Nov. 2 at $33.02 and Monday’s price action forming the higher high. By late morning, however, Lucid looked to be printing a bearish inverted hammer candlestick, which could indicate lower prices are in the cards as the stock consolidates.
The consolidation is needed because Lucid’s relative strength index (RSI) is measuring in at about 83%. When a stock’s RSI reaches or exceeds the 70% level it becomes overbought, which can be a sell signal for technical traders. Bullish traders in a position will want to watch for the consolidation to happen on low volume for confirmation the bulls remain in control of the stock.
Lucid is trading above the eight-day and 21-day exponential moving averages (EMAs), with the eight-day EMA trending above the 21-day, both of which are bullish indicators.
The stock is also trading well above the 50-day simple moving average, which indicates longer-term sentiment is bullish. It should be noted Lucid is extended from all three moving averages, which also indicates consolidation may be needed.
- Bulls want to see sideways consolidation on low volume and then for big bullish volume to come in and push Lucid up to completely fill the higher gap. The stock has resistance above at $50.32, and then there is not much more resistance until the Feb. 18 all-time high of $64.86.
- Bears want to see big bearish volume come into Lucid to drop the stock down below $41.37, which would cause the stock to fill the lower gap left behind on Monday. Below the level, Lucid has further support at $35.72 and $33.02.
(Click on image to enlarge)
© 2021 Benzinga.com. Benzinga does not provide investment advice. All rights reserved.


