

Image Source: Unsplash
Lululemon (LULU) collapsed from $516 to $165 in two years.
Everyone dumped it. Money managers rotated out during quarter-end window dressing. Retail traders avoided it because the chart looked like death.
I stepped in and bought 50 shares at $165.
Not because I love yoga pants. Not because I'm bullish on retail. Because the math stopped making sense at these levels.
The stock traded at 11x earnings with 16% net margins and 22% return on assets. At that valuation, this isn't a trade. It's theft.
Charts show you what happened. Numbers show you what something's worth. When those two disconnect completely, that's your opportunity.
Every major reversal starts with stocks trading at absurd disconnects from their actual value.
The math says buy, but everyone stays away because the chart looks broken. Then algorithms finally recognize the setup, and the stock doubles in months.
Spotting one of these disconnects is straightforward when you dig into the numbers.
Finding all of them before algorithms confirm the reversal is impossible manually.
Today I'm showing you the five-minute framework that found this opportunity.
The Breakdown Nobody Believes
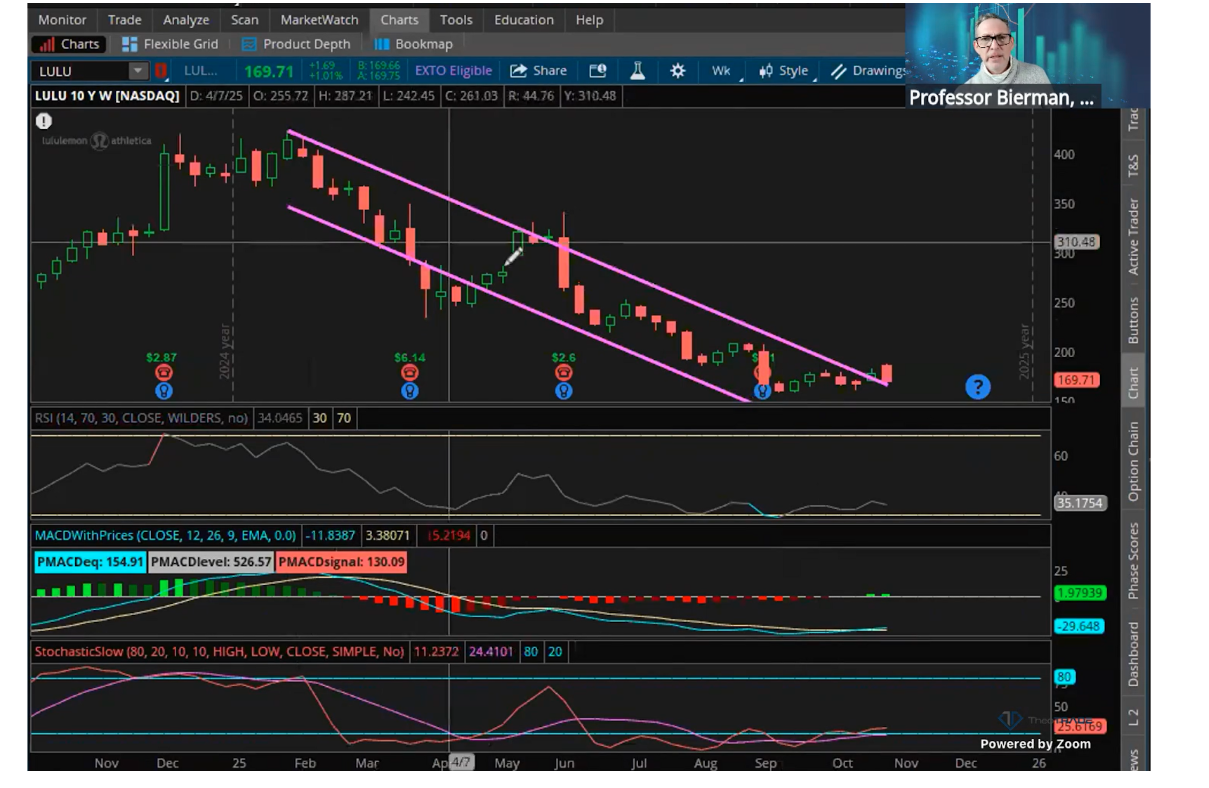
Pull up Lululemon's two-year chart. What do you see?
Straight down. Relentless selling. No support. No bounce. Just algorithmic destruction walking the stock lower in a perfect downward channel.
Most traders stop looking right there. The chart says sell. Momentum says avoid. Everyone who bought higher is underwater. Stay away.
That's exactly when I start digging into numbers.
The chart doesn't show fundamentals improving while the stock collapsed. It doesn't show valuation compressing to levels that make no mathematical sense. It especially doesn't show the algorithmic channel that just broke.
The Numbers Wall Street Ignores
I ran a five-minute fundamental analysis. Not complex. Not academic. Just the metrics that actually matter.
- Return on assets: 22%. For a retail company, that's exceptional. Compare that to Nike at 15% or any department store at 8%. Lululemon generates $22 in profit for every $100 in assets.
- Net margins: 16%. Nike delivers 10%. Under Armour barely scrapes 4%. Lululemon earns 16 cents on every dollar of sales while competitors struggle to maintain single digits.
- PE ratio: 11 times earnings. Nike trades at 33 times. The five-year average for Lululemon itself was 35 times. This stock compressed from bubble valuation to deep value territory in 24 months.
- Debt-to-equity: 23%. They're barely leveraged. Current ratio of 3.0 means massive cash reserves. They could acquire a competitor tomorrow without blinking.
I ran this same analysis against every retail peer I could find. Lululemon beats them all on margins. Beats them all on asset efficiency. Trades at a fraction of their multiples.
The disconnect became impossible to ignore. Strong fundamentals, absurd valuation, pure chart-based selling with zero analysis behind it.
The Technical Signal That Triggered My Buy
The stock broke outside the two-year downward channel at $165.
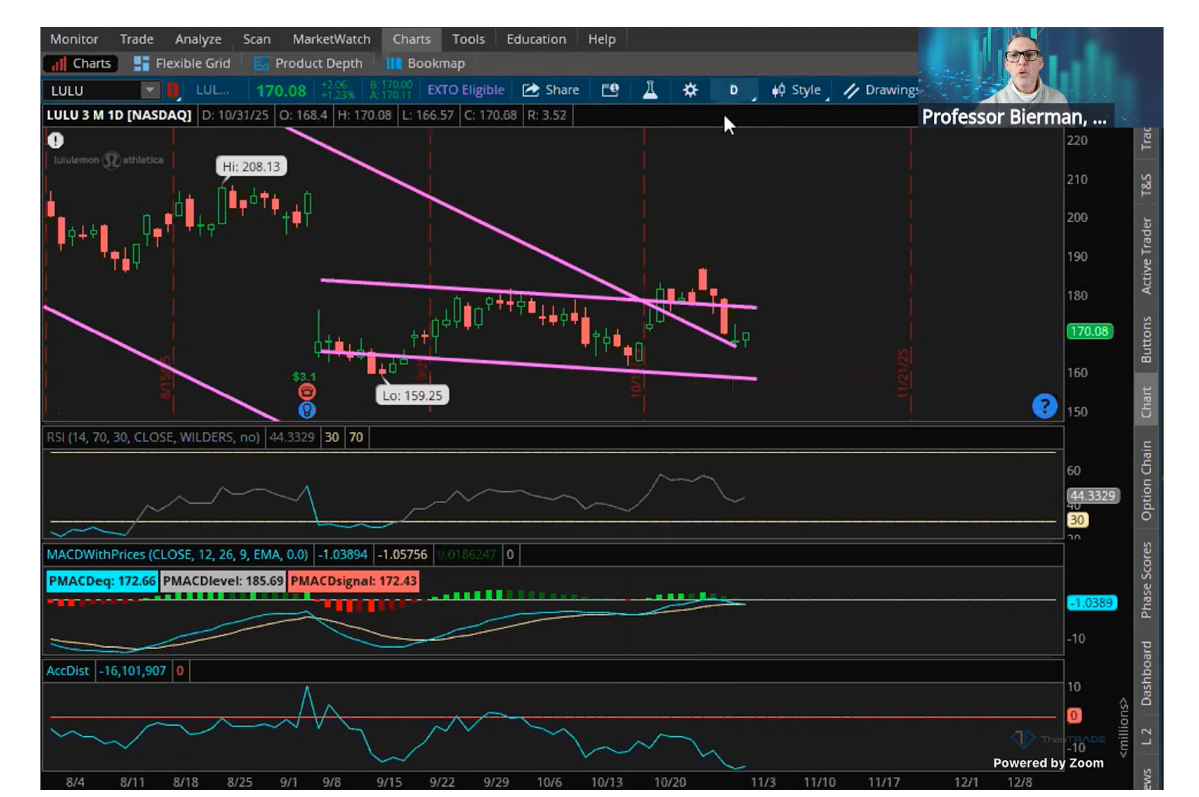
This matters for one specific reason. Algorithms that systematically sold every bounce for 24 months just detected a pattern change. The machines aren't defending the downward slope anymore.
The weekly MACD sits deep underwater at negative 40. But watch that indicator. If it pivots upward toward the signal line, this becomes the comeback trade of the year. That's the momentum shift that separates temporary bounces from sustained reversals.
Money flow tells the rest of the story. Nobody owns this stock anymore. All the overhead supply got flushed out during the two-year collapse. Everyone who bought at $300, $400, $500 has already capitulated. There's nothing left blocking a move higher.
The Risk-Reward Math
I bought 50 shares at $165. My risk? Maybe $20 downside to book value support. That's $1,000 total exposure.
My reward? If this stock gets above $200 and algorithms confirm the reversal, it's going to $450. That's not hopium. That's the math of what happens when deep value meets technical breakout.
Once algos recognize a reversal setup, the move accelerates systematically. Buying pressure replaces selling pressure. Short covering adds fuel. Institutions rotate into beaten-down names with improving fundamentals. Retail finally notices after the move is already 30% complete.
I've watched this pattern repeat. FedEx collapsed to absurd levels, then doubled. Meta got destroyed, then ran 200%. Target broke down hard, then rallied 40% in weeks. Good companies get beaten to irrational prices. Charts look terrible. Everyone stays away. Then algorithms flip, and the stock explodes.
My Exit Strategy
I'll sell 25 shares if it hits $185. Lock in some profit. Hold the rest through December 11th earnings.
If the weekly MACD turns positive and the stock breaks $200, I'll hold for $250. If I'm wrong and it drops to $145, I'll add more. Because at that valuation, this becomes a floor trade where fundamentals simply won't let it go much lower.
Michael Burry bought a block for around $180 for the same reasons I did. The fundamental disconnect was too obvious. When someone who predicted the housing crisis steps into a hated retail stock, that confirms the value proposition exists. I'm not following him. We're both following the math.
The Framework That Finds These Setups
Wall Street trades momentum. They buy what's going up and sell what's going down. That works until it doesn't.
The opportunity exists in the gap between chart-based selling and fundamental reality. When those two things disconnect completely, you get setups like Lululemon.
The algorithms will eventually figure this out. They always do. The question is whether you're positioned when they flip from systematic selling to systematic buying.
Run your own five-minute analysis on beaten-down stocks. Check the margins against competitors. Compare the valuation to historical norms and peer groups. Look for the technical confirmation when downward channels break. Then size appropriately with defined risk.
More By This Author:
Most Market Sectors Are Getting SmokedThree Consumer Names About To Get Crushed
The Fed Cut Rates. Bonds Collapsed Instead

Comments
Log in or sign up to join the conversation.