

Image Source: Pixabay
Last week, we entered the final two trading months in 2023. Everyone is wondering what to expect from seasonal market trends in 2023. Will stocks and indices finish higher – not just the big names like the Magnificent Seven that have been dominating bullish activity this year?
I recently wrote about how most of the stock market was down for the year. If you looked at equal-weighted performance, the S&P 500 and Russell 2k were down; the Dow was flat.
But as we turned the calendar to November last week, a significant mental burden was lifted off the shoulders of investors and traders.
Look at history when considering seasonal market trends in 2023
The magic dust of seasonal market trends can be powerful and lead to some very strong moves. If you look at historical patterns since 2004 (see the S&P 500 chart below), you can see logical and methodical stock market movements by month. The Dow Industrials also has seasonal patterns that clearly show bullish and bearish trends develop during the calendar year.
The worst six-month period for the stock market is commonly accepted as May through October – hence you “sell in May and go away.” This was first pointed out by Yale Hirsch decades ago. Take a look at the chart below, which isolates a 20 year period for the S&P 500. It’s interesting to note that November is tied for the best-performing month of the year (75). December is not far behind (68).
(Click on image to enlarge)
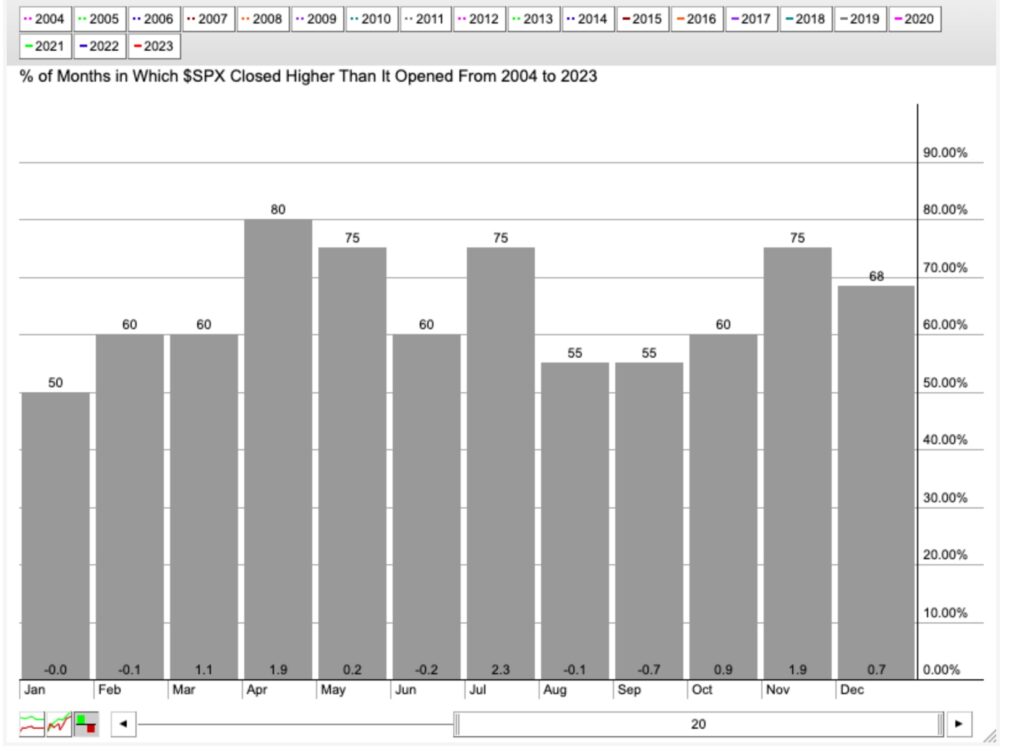
Three months in the spring and summer also have a strong history for positive performance. Just look at April, May, and July (thus contradicting Mr. Hirsch’s advice).
Of course, economic and market conditions are often very different from year to year. There is no guarantee these particular seasonal patterns will hold up. Frankly, I would be shocked if it happened every year.But, as a timing tool to help you understand investor/trader behavior at certain times of the year, this chart is extremely helpful.
Last week, we saw very strong bullish influence that pushed markets 6% higher. Over the past 40 years, the stock market was up 90% of the time during the last few days of October and the start of November. That’s a strong statistic!
So yes, the markets have a great, bullish track record during November and December. Just remember that the stock market can be impacted by other influences, so keep your eye on them.
More By This Author:
Walmart Inc Chart Analysis
Trading Is A Mental Game: How To Win It
Netflix Inc. Chart Analysis


Comments
Log in or sign up to join the conversation.