
What To Expect From Airline Industry Earnings

Image: Bigstock
Airline companies have benefited from the economic reopening and the easing of travel restrictions, reversing the earlier losses suffered as the pandemic took hold.
The pandemic was nothing less than a bolt from the blue for the group as travel demand disappeared overnight. Many operators would have found it hard to survive had it not been for the generous government assistance. As was the case with other operators in the broad travel, leisure and hospitality space, airline stocks reached pre-pandemic levels as vaccines got discovered.
You can see this in the chart below that shows the Zacks Air Transportation subsector's performance since the start of 2020. The blue line in the chart represents the Zacks Air Transportation sub-sector while the red line represents the S&P 500 index.
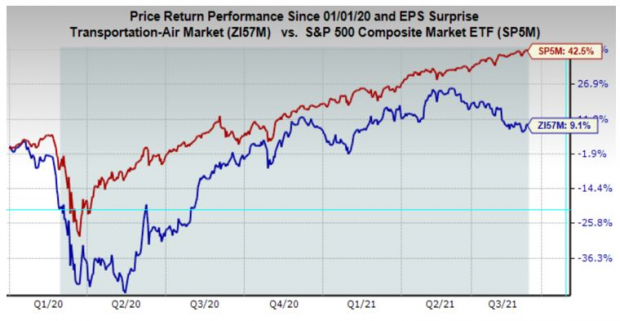
Image Source: Zacks Investment Research
Please note that the Zacks Air Transportation sub-sector is very broad and includes, in addition to the major carriers like United (UAL - Free Report), Southwest (LUV - Free Report) and others to international operators, traditional transportation players like FedEx (FDX - Free Report), UPS (UPS - Free Report) and others.
As you can see in the above chart, the group’s stock market recovery has been impressive, but it nevertheless lagged the broader market in the timeframe.
The group has done better than the market when we look at a shorter time horizon, for example, the past year or the year-to-date period. The chart below looks at the group’s performance over the past year.
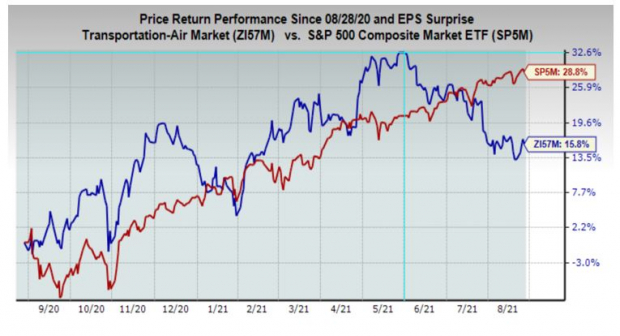
Image Source: Zacks Investment Research
The reversal of this outperformance trend began at the start of the Summer as the Delta variant started becoming a threat to the group’s outlook.
It is important to note here that, unlike the group’s recent stock market pullback, the group’s profitability outlook continues to improve. The chart below plots the group’s stock market performance (blue line) and the aggregate revisions trend in forward 12-month EPS estimates (the green line).
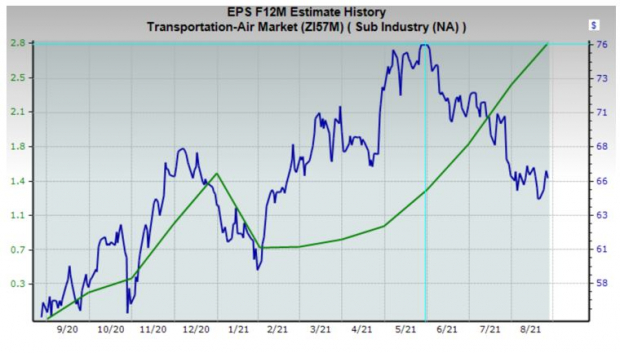
Image Source: Zacks Investment Research
The chart below shows the group’s aggregate earnings picture on a quarterly basis, with actual results for the last eight quarters and estimates for the coming four periods.
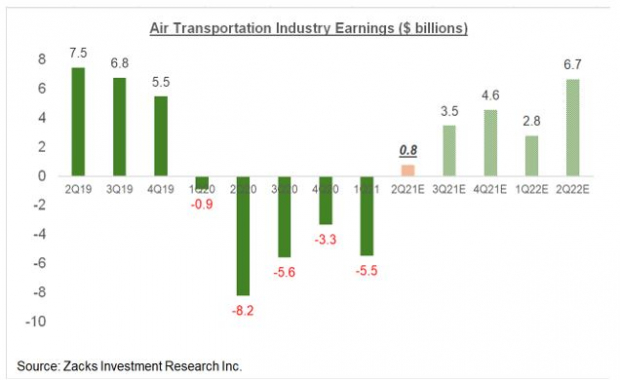
Image Source: Zacks Investment Research
Please note that the above chart represents data only for the Zacks Air Transportation sub-sector in the S&P 500 index.
As you can see above, the group’s profitability turned positive in 2021 Q2 after staying in the red in the preceding five periods. The profitability outlook is expected to steadily improve in the coming periods, but aggregate 2021 Q3 earnings for the group are roughly half of the pre-Covid profitability level.
The chart below shows the quarterly earnings picture for the Zacks Transportation sector, of which the Air Transportation subsector is one part.
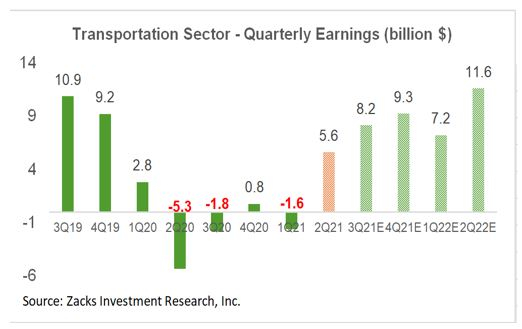
Image Source: Zacks Investment Research
The chart below presents the data on an annual basis.
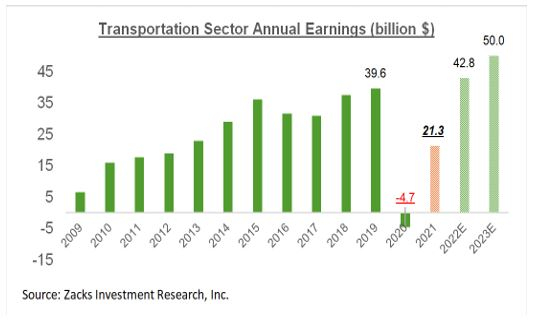
Image Source: Zacks Investment Research
As you can see in the annual chart above, the group’s profitability is expected to move above pre-Covid levels next year.
S&P 500 Earnings Outlook
The chart below shows the year-over-year earnings and revenue growth rates for the S&P 500 index.
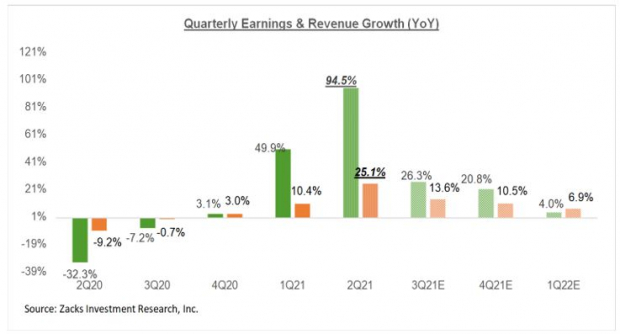
Image Source: Zacks Investment Research
As you can see above, the expectation is for +26.3% earnings growth and +13.6% revenue expansion in the current period (2021 Q3), a significant deceleration from the break-neck pace of 2021 Q2. Keep in mind, however, that a big part of the 2021 Q2 earnings growth was because of easy comparisons to the year-earlier period. The growth rates become more normalized as the comparisons issue becomes normal.
More important than the year-over-year growth rate is the trend in estimate revisions for 2021 Q3 and beyond.
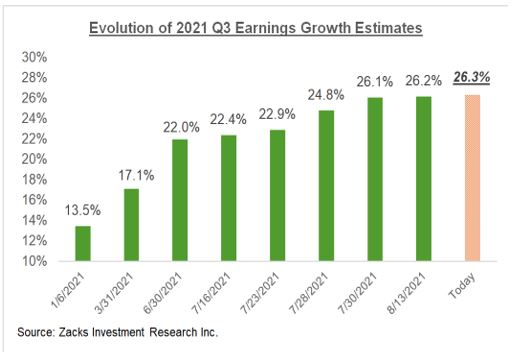
Image Source: Zacks Investment Research
Please note that while the revisions trend remains, it is weaker than what we had seen in the comparable periods in the preceding two quarters.
A relatively favorable view of this decelerating revisions trend is that it reflects conservatism in the face of the Delta variant, setting us up for bigger positive surprises as the reporting cycle gets underway.
On the other hand, one could view this chart as the beginning of a reversal in the revisions trend that has been positive since July 2020 and has been a big source of support for the market.
It is hard, if not altogether impossible, to say which of these two views will pan out, but we will be keeping a watchful eye on this trend.
The chart below shows the earnings picture on an annual basis.
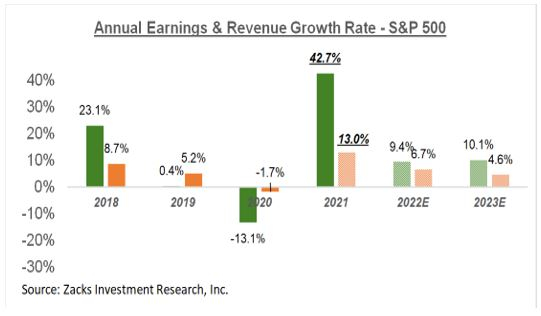
Image Source: Zacks Investment Research
Disclosure: Zacks.com contains statements and statistics that have been obtained from sources believed to be reliable but are not guaranteed as to accuracy or completeness. References to any specific ...
more

