

Image Source: Pixabay
The combination of Walmart’s (WMT - Free Report) beat-and-raise quarterly release and the positive July Retail Sales report has forced the gloom-and-doom narrative that threatened to take center stage just a few days ago into retreat.
The clouds have not fully lifted yet, though, and downside risks still remain. But for now, at least, the soft-landing narrative is back in the ascendant, which has done wonders for market sentiment. Also helping market sentiment is further evidence from the July CPI reading that reassured investors on the inflation question.
Even before the July CPI report, many in the market had already realized that the Fed’s priority had shifted from price stability to full employment. A rate cut at the central bank’s September meeting is now a given, with the magnitude of the cut as the only point of uncertainty. A bigger-than-normal cut will be seen as a sign of concern from the Fed about the growth outlook.
Some in the market discount the significance of the robust Walmart earnings report as a helpful read-through on consumer spending trends and the state of household finances. Walmart’s strong results for the May through July period and upgraded guidance for the current and coming periods provides further evidence of the economy’s resilience in the face of many challenges.
Walmart is no longer simply a big box retailer as it has a growing digital footprint that has proved to be a worthy competitor to Amazon (AMZN - Free Report). The company has been gaining market share for a while now by attracting higher-income households to its convenient delivery and pick-up services.
Walmart has captured a bigger market share due to its digital investments, which has also made its website a desirable advertising destination. Such advertising revenues are higher margin for Walmart, just as they are for Amazon. Management talked about use cases of artificial intelligence in the digital business, further evidence that this is no longer the old Walmart.
Target (TGTTGT - Free Report), which reports quarterly results on Wednesday, August 21st, has some reassuring read-throughs from the Walmart report, particularly management’s commentary about stability and favorable trends in non-essential merchandise.
A big difference between Walmart and Target is the weightage of groceries and other essentials in the business mix, which accounts for about two-thirds of Walmart’s revenues. Target is more weighted towards non-essentials, with groceries accounting for about a third of the total. Households have been spending less on such discretionary categories as furniture, apparel, and others in the post-Covid world, which has been problematic for Target and others.
Walmart noted improvements in some of the non-grocery merchandise on its earnings call, which will likely be confirmed in the Target report as well.
Target shares have been big-time laggards this year, as the chart below shows. The year-to-date performance chart below shows Target (red line: up +0.8% YTD) relative to the S&P 500 index (green line: up +16.2%), Amazon (orange line: up +16.7%), and Walmart (blue line: up +39.4%).
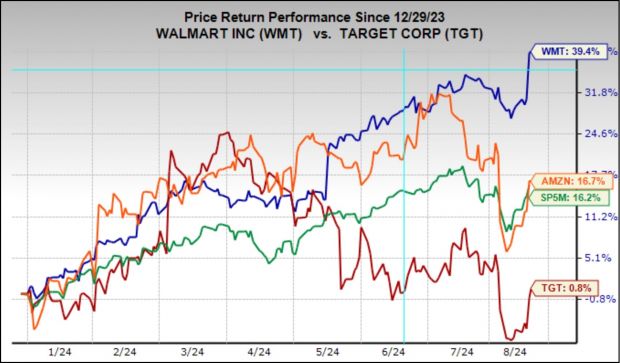
Image Source: Zacks Investment Research
With respect to the Retail sector 2024 Q2 earnings season scorecard, we now have results from 26 of the 36 retailers in the S&P 500 index. Please note that these 26 retailers account for 89.2% of the sector’s market capitalization in the S&P 500 index.
Regular readers know that Zacks has a dedicated stand-alone economic sector for the retail space, which is unlike the placement of the space in the Consumer Staples and Consumer Discretionary sectors in the Standard & Poor’s standard industry classification.
The Zacks Retail sector includes not only Walmart, Target, and other traditional retailers but also online vendors like Amazon (AMZN - Free Report) and restaurant players. The 26 Zacks retail companies in the S&P 500 index that have reported Q2 results already belong to the e-commerce, restaurant industries, and some of the conventional retailers, such as Walmart, which have reported already.
Total Q2 earnings for these 26 retailers that have reported are up +19.3% from the same period last year on +5.3% higher revenues, with 57.7% beating EPS estimates and only 42.3% beating revenue estimates.
The comparison charts below put the Q2 beats percentages for these retailers in a historical context.
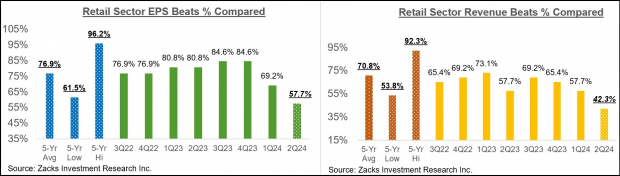
Image Source: Zacks Investment Research
As you can see above, the Retail sector companies have struggled with beating EPS and revenue estimates in Q2. In fact, Q2 EPS and revenue beats percentages for these players represent a new low over the preceding 20 quarters (5 years).
With respect to the elevated earnings rate at this stage, we like to show the group’s performance with and without Amazon, whose results are among the 26 companies that have reported already. As we know, Amazon’s Q2 earnings were up +99.8% on +10.1% higher revenues, as it beat on EPS but missed top-line expectations.
As we all know, the digital and brick-and-mortar operators have been converging for some time now, with Amazon now a decent sized brick-and-mortar operator after Whole Foods and Walmart a growing online vendor. As we noted in the context of discussing Walmart’s results, the retailer is steadily becoming a big advertising player thanks to its growing digital business. This long-standing trend got a huge boost from the Covid lockdowns.
The two comparison charts below show the Q2 earnings and revenue growth relative to other recent periods, both with Amazon’s results (left side chart) and without Amazon’s numbers (right side chart)

Image Source: Zacks Investment Research
As noted earlier, we have started seeing signs of stress at the lower end of income distribution, and one can intuitively project moderation in consumer spending as the economy further slows down under the weight of tighter monetary conditions. Inflation may be down from the multi-decade highs of a few quarters back, but it still remains a headwind, particularly for the lower end of income distribution. That said, the labor market remains very strong, with wages still going up.
We will hear more about this and other headwinds on the Q2 earnings calls, likely in the context of their outlooks for the coming periods.
Earnings Season Scorecard and This Week’s Earnings Reports
Through all the results that came out on Friday, August 16th, we have seen Q2 results from 464 S&P 500 members, or 92.8% of the index’s membership. Total earnings for these index members are up +8.3% from the same period last year on +5.2% higher revenues, with 79.3% beating EPS estimates and only 59.5% able to beat revenue estimates.
Plenty of Q2 results are still to come, even though we have already seen results from more than 92% of S&P 500 members. This week brings in results from over 100 companies, including 14 S&P 500 members. The notable companies on deck to report results this week include, besides the aforementioned, Target, Lowe’s, Macy’s, TJX Companies, Urban Outfitters, and others.
The comparisons charts below put the earnings and revenue beats percentages for these companies in a historical context.

Image Source: Zacks Investment Research
The one notable feature of the above comparison charts is the very low level of Q2 revenue beats percentage. In fact, the Q2 revenue beats percentage of 59.5% is a new low for this group of index members over the preceding 20-quarter period (5 years).
Revenue beats have been low from the start of the reporting cycle, a trend that will carry through to the end of the earnings season.
The comparison charts below put the Q2 earnings and revenue growth rates for these companies in a historical context.

Image Source: Zacks Investment Research
The Earnings Big Picture
Looking at Q2 as a whole, combining the actual results that have come out already with estimates for the still-to-come companies, total S&P 500 earnings are expected to be up +9.5% from the same period last year on +5.4% higher revenues.
This is the highest earnings growth pace in the last eight quarters since the +10% growth rate in 2022 Q1. The Q2 aggregate earnings total is on track to be a new all-time quarterly record, as the chart below shows.

Image Source: Zacks Investment Research
The chart below that shows the year-over-year earnings and revenue growth for 2024 Q2 in the context of what we saw in the preceding four periods and what is currently expected for the following three periods.

Image Source: Zacks Investment Research
For the current period (2024 Q3), total S&P 500 earnings are expected to be up +4.2% from the same period last year on +4.6% higher revenues.
Please note that estimates for Q3 have been steadily coming down, with the current +4.2% earnings growth rate down from +6.9% in early July, as the chart below shows.

Image Source: Zacks Investment Research
This is a bigger cut to estimates relative to what we saw in the comparable periods for the preceding two quarters. The negative revisions trend is broad-based, with estimates for 14 of the 16 Zacks sectors getting cut since the quarter began. The most significant cuts have been to the Transportation, Business Services, Energy, Aerospace, and Basic Materials sectors. On the positive side, estimates for the Tech sector are increasing, while those for the Finance sector are only marginally higher relative to where we started in early July.
Looking at earnings expectations on an annual basis, total 2024 S&P 500 earnings are expected to be up +8.1% on +1.7% revenue growth. Excluding the Energy sector drag, whose earnings are now expected to be down -10.8% in 2024, total earnings for the rest of the index would be up +9.6%.
The expected 2024 revenue growth pace improves to +4.1% once Finance is excluded from the aggregate data, with the index level aggregate earnings growth for the year declining only to +7.7% on an ex-Finance basis.
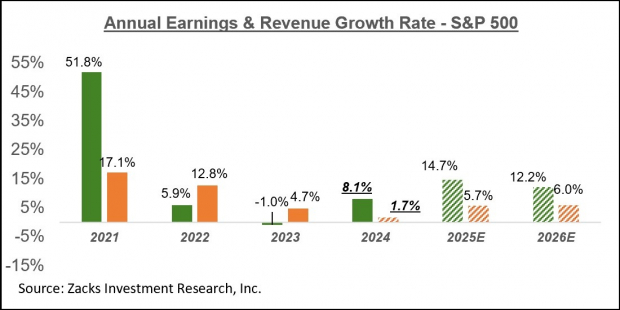
Image Source: Zacks Investment Research
Unlike the calendar year view that the above chart shows, the chart below the earnings data on a rolling four-quarter basis

Image Source: Zacks Investment Research
More By This Author:
Earnings Estimates Face Pressure: What To KnowRetail Earnings Loom: A Preview
Top Stock Reports For Mastercard, AMD & Intuit


Comments
Log in or sign up to join the conversation.