Volatility Before Opportunity: AT&T Correction Sets Up Rally
Image Source: Unsplash
Analysts still maintain a Moderate Buy consensus with an average price target of about $30.6, implying nearly 20% upside from current levels. However, forecasts suggest short‑term weakness: AT&T (T) could dip toward $23.4 by the end of November and $22.1 in December, reflecting a potential 10% decline. This near‑term pressure stems from market fatigue and broader telecom competition, yet the company’s fundamentals remain intact. AT&T has reiterated its 2025 guidance of adjusted EPS between $1.97 and $2.07 and free cash flow above $16 billion, supported by fiber expansion and debt reduction plans.
Looking forward, AT&T’s strategy of scaling fiber coverage and leveraging wireless spectrum should gradually strengthen its position. Transitioning away from legacy assets and focusing on convergence is expected to improve EBITDA growth toward 5% by 2027–2028. Moreover, management’s commitment to reducing leverage to 2.5x EBITDA by mid‑2025 enhances balance sheet resilience. Therefore, while the next few months may bring volatility and possible downside, disciplined investors could benefit from dividends and long‑term appreciation as AT&T executes its multi‑year growth plan. The key will be navigating short‑term corrections while staying aligned with the broader structural uptrend.
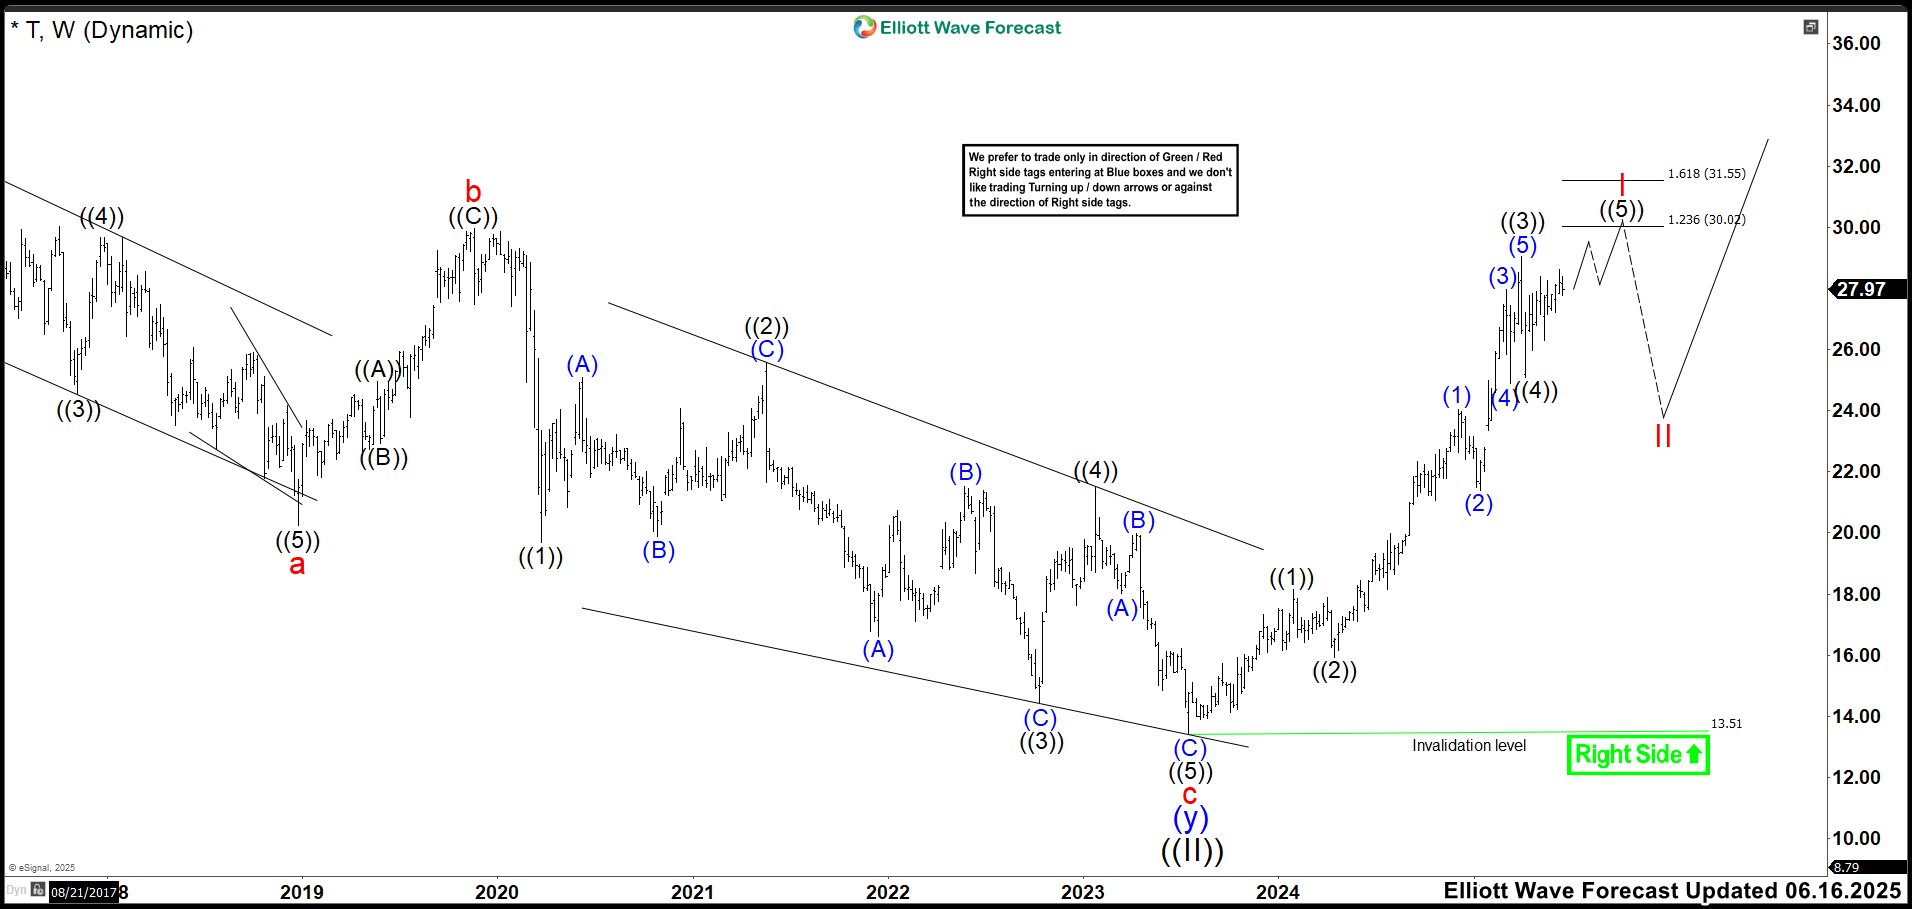
Elliott Wave Outlook: AT&T (T) Weekly Chart June 2025

In June, the stock price kept rising as expected, signaling an extension in wave ((3)). We identified the 29.03 high as the likely end of wave ((3)), while support for wave ((4)) appeared at the 25.10 low. From there, the market needed to break decisively above 29.03 in order to propel wave ((5)) toward the 30.02–31.55 target zone. A bearish reaction inside that zone would confirm the completion of impulse wave I. Nevertheless, we acknowledged that upward extensions could still unfold beyond that range.
At the same time, we prepared for the possibility that the market might fail to break above 29.03. In that case, wave ((4)) would still be developing, opening the door for a decline toward 24.66–23.72 before completing wave ((4)). Once that correction finished, the bullish move in wave ((5)) would resume. Importantly, a clean break above 29.03 would invalidate this alternative and reinforce the direct path higher. (If you want to learn more about Elliott Wave Principle, please follow these links: Elliott Wave Education and Elliott Wave Theory.)
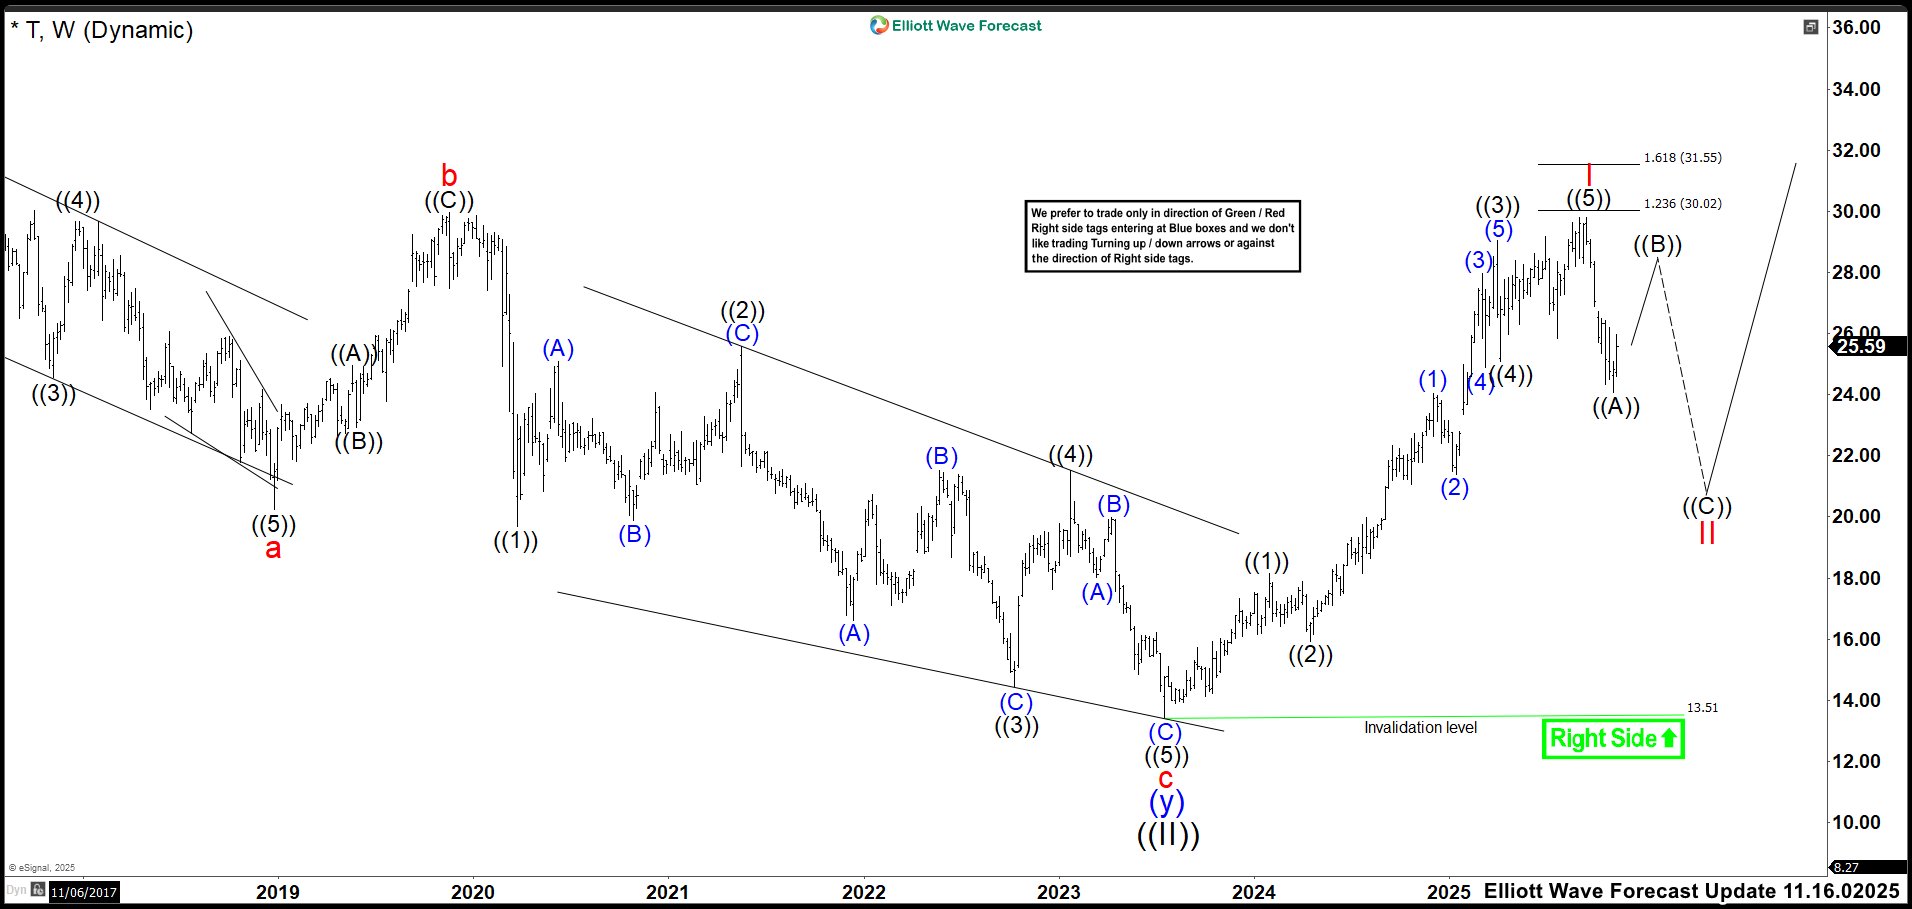
Elliott Wave Outlook: AT&T (T) Weekly Chart Noviembre 2025
On September 15, T completed the cycle that began in 2023, reaching 29.79 per share. The price missed the ideal target zone by just a few cents. Wave ((5)) formed an ending diagonal, which finalized impulse wave I and triggered a reversal. From that peak, the market declined into the expected 24 area. However, this drop represents only wave ((A)) of corrective wave II.
Now, we anticipate a rebound in wave ((B)). This recovery should remain capped below 29.79. Afterward, the market is expected to fall again in wave ((C)) of II. The ideal completion zone for this correction lies between 22.00 and 19.70. Within that range, we could look for new buying opportunities aimed at breaking above the impulse wave I high of 29.79.
More By This Author:
Elliott Wave Analysis: Spot Silver Targeting Fresh All-Time HighsDow Futures Breaks Record : Five Waves Elliott Wave Impulse In Sight
Elliott Wave Analysis Of Nasdaq Forecasts New All Time High, Targeting At Least 26793
Disclaimer: Futures, options, and over the counter foreign exchange products may involve substantial risk and may not be suitable for all investors. Leverage can work against you as well as for ...
more


