
Virgin Galactic Holdings, Inc (SPCE) was trading up about 4% higher in the premarket on Wednesday and rallying over 14% higher when the market opened after printing mixed fourth-quarter financial results.
On Tuesday after the market close, Virgin Galactic reported earnings per share of ($0.31), which beat the estimate of ($0.34) and sales of $141,000, which missed the estimate of $330,000. Virgin Galactic’s low revenue is unlikely to affect investor sentiment because the company was still largely in a pre-revenue state during the quarter.
On Feb. 16, Virgin Galactic announced a resumption of ticket sales and CEO Michael Colglazier said the space tourism company plans to take 1,000 customers to space by the end of 2022.
Despite nearing a commercial flight program, Virgin Galactic has been beaten down by the market, declining 86% from the 52-week high on June 25 of $57.51 to reach a 52-week low of $7.58 on Jan. 24 and Jan. 28.
The market is forward-looking, however, and if Virgin Galactic can demonstrate it will meet its new timeline to take customers to space without further delays, the stock could be set for take off.
The Virgin Galactic Chart: On Tuesday, Virgin Galactic traded down toward its 52-week low again and wicked up from the area. Combined with similar price action at that level on Jan. 24 and Jan. 28, the stock may have created a bullish triple bottom pattern on the daily chart. Traders and investors can watch to see if higher-than-average volume comes in on Wednesday to gauge whether the pattern was recognized.
Virgin Galactic’s stock fell lower than the Feb. 14 low-of-day on Tuesday, but the relative strength index (RSI) didn’t make a lower low, which has created bullish divergence. Bullish divergence can signify a turning point, where a stock may reverse course to the upside.
The stock has a gap above on the chart between $10.97 and $12.06 that was left behind on Jan. 13. Gaps on charts fill about 90% of the time, which indicates Virgin Galactic is likely to rise up to trade into the range in the future.
Virgin Galactic is trading below the eight-day and 21-day exponential moving averages (EMAs), with the eight-day EMA trending below the 21-day, both of which are bearish indicators. The stock is also trading below the 50-day simple moving average, which indicates longer-term sentiment is bearish.
- Bulls want to see big bullish volume come in and boost Virgin Galactic up above the EMAs, which could cause the stock to regain a resistance level as support at the $10.65 mark and push Virgin Galactic up into the gap. Above the level, there is further resistance at $13.34 and $17.47.
Bears want to see big bearish volume come in and drop Virgin Galactic below its 52-week low, which would put the stock in risk of falling toward the all-time low of $6.90. Below the area, there is no further support in the form of price history.
(Click on image to enlarge)
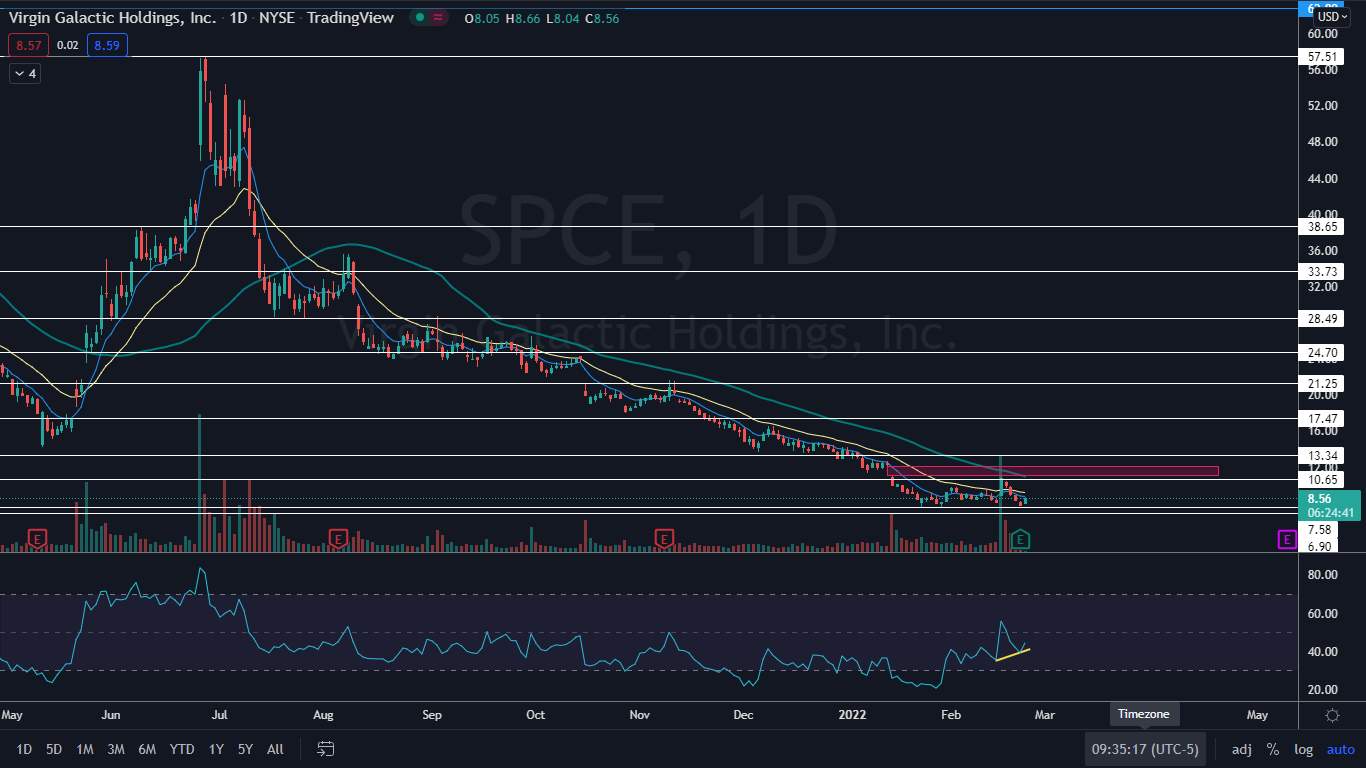
Photo: Courtesy of pressftp.virgingalactic.com
To reserve a seat aboard a flight, customers are required to make a deposit of $150,000 and pay an additional $300,000 prior to take off. These revenues will be visible when Virgin Galactic reports its first-quarter results later this year.


Comments
Log in or sign up to join the conversation.